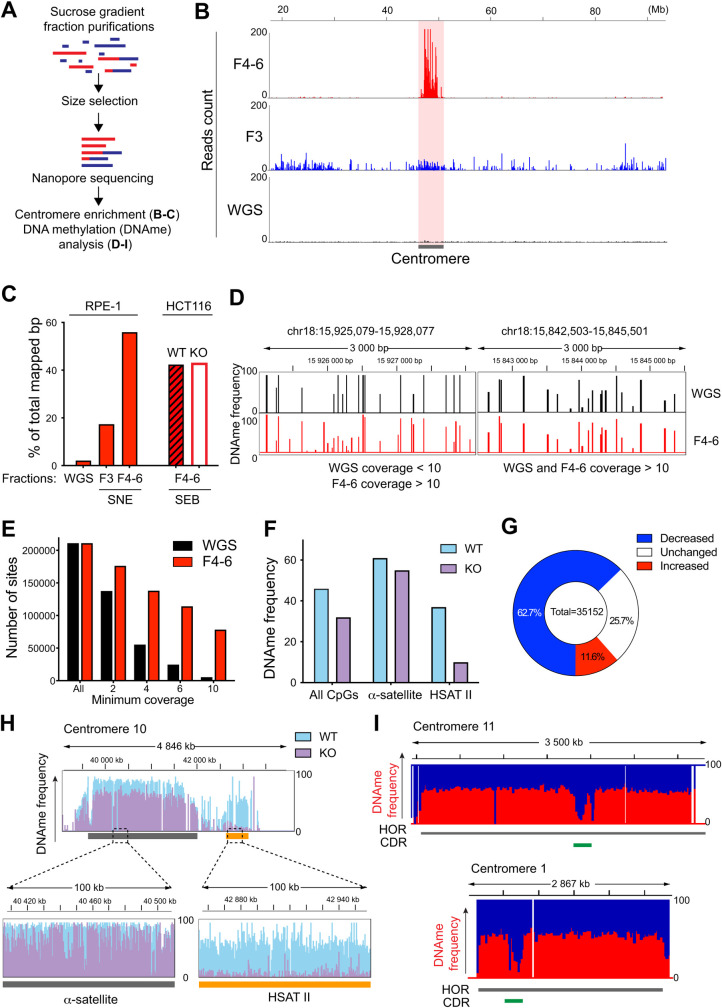
Fig 4. CenRICH is suitable for long read sequencing and DNA methylation analysis.
A. Schematic representation of the experimental design. B. Coverage profiles of the centromeric region of chromosome 5 after Nanopore sequencing of an undigested sample (WGS), fraction 3 (F3) and a pool of fractions F4, F5 and F6 (F4-6) after CenRICH with SNE enzyme combination. Genomic coordinates are reported on top. C. Quantification of base-pairs from Nanopore reads that map within the centromeric regions (as defined in S1 Table) after CenRICH with the SNE enzyme combination (RPE-1 cells, fractions F3 or a pool of fractions F4 to F6) or SEB enzyme combination (HCT116 cells, pool of fraction F4 to F6). WT and KO indicate the genotype of the two HCT116: wild-type or DNMT1 and DNMT3B knock-out, respectively. WGS indicates the value for an undigested unfractionated sample of RPE-1 DNA. Base-pair counts are expressed as percentage of total number of mapped base-pairs. D. Methylation frequencies of individual CpG sites (expressed as a level from 0 to 100%) detected by Nanopore sequencing in different regions of centromere 18. WGS represents a non-enriched sample of RPE-1 cells, while F4-6 represents RPE-1 DNA that underwent CenRICH. Only CpG sites that are called both in WGS and F4-6 are reported. Left panel shows a portion of cen18 where methylation calls derive from a coverage of less than 10 reads in WGS but more than 10 in F4-6. Right panel shows a portion of cen18 where methylation calls derive from a coverage of more than 10 reads in both samples. E. Distribution of CpG sites based on the minimum coverage. The minimum coverage is expressed as number of Nanopore reads covering the site. WGS: undigested unfractionated RPE-1 sample. F4-6: fractions F4 to F6 after CenRICH with SNE enzyme combination on RPE-1 cells. F. Average methylation frequency (expressed as percentage) detected by Nanopore sequencing in HCT116 cells that underwent CenRICH with the SEB enzyme combination. Values are reported for all included CpGs, for the ones in alpha satellite and for the ones in HSATII. WT and KO indicate the genotype of the two HCT116: wild-type or DNMT1 and DNMT3B knock-out, respectively. Only CpGs with methylation calls in both samples are included in the analysis. G. Proportions of CpG sites that show higher, lower, or equal methylation frequency in HCT116 DNMT1/3B double KO (KO) compared to HCT116 wild-type (WT), same cell samples as in F. Only sites with methylation frequency > 40% in WT and coverage >10 in both samples are included. A site is labelled as increased or decreased if the difference in methylation frequency is respectively > 10% or < -10% in KO compared to WT, otherwise it is labelled as unchanged. H. Example of methylation frequency measured by Nanopore sequencing on the same HCT116 samples as in F. The genomic interval includes the alpha satellite array of chromosome 10 (grey bar) and a flanking pericentromeric HSATII array (yellow bar). Y-axis ranges from 0 to 100. I. Example of detection of Centromere Dip Region (CDR) on chromosomes 11 and 14 after performing CenRICH with the SNE combination on CHM13 cells. The red profile represents the methylation frequency with y-axis ranging from 0 to 100%. White portions of the plot represent regions with no methylation calling. The green bar represents the CDR as previously identified in CHM13 [34].

