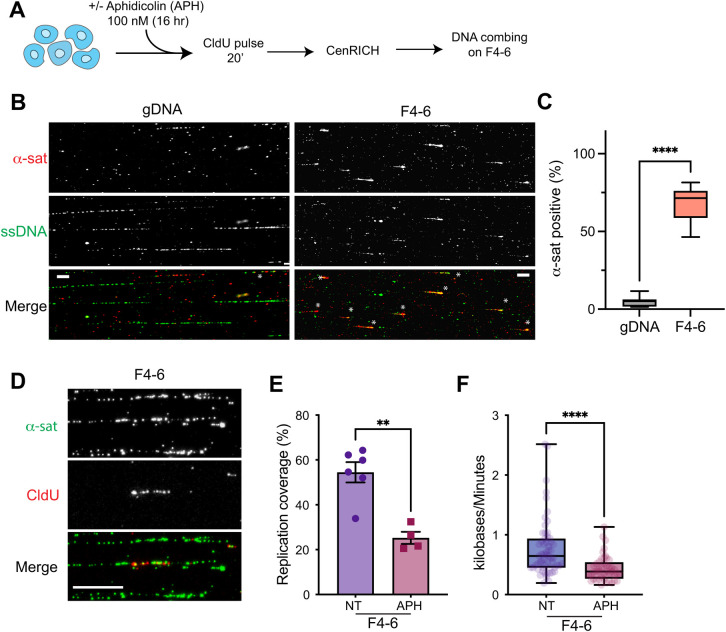
Fig 5. CenRICH is suitable for single molecule replication analysis.
A. Schematic representation of the experimental design. B. Representative images of DNA fibers hybridized with an anti single-stranded DNA (ssDNA) antibody and biotin labelled α-satellite probe in the indicated condition. Asterisks mark α-satellite positive fibers. Scale bar 20 μm (gDNA) and 10 μm (F4-6). C. Box and whiskers plot shows the percentage of DNA fibers that are positive to hybridization with α-satellite probe, in a non-enriched sample of RPE-1 DNA (gDNA) or in the HMW fraction after CenRICH on RPE-1 cells with the SNE enzyme combination. Fibers of less than 10 kb were excluded from the analysis. n = > 350 fibers for F4-6 and > 230 for gDNA. Mann Whitney test, p < 0.0001. D. Representative images of CldU incorporation on combed DNA fibers, as marker of ongoing replication in RPE-1 cells that underwent CenRICH with the SNE enzyme combination. Scale bar 10 μm. E. Mean cumulative percentage of DNA fibers showing CldU incorporation in an untreated sample (NT) or in a sample treated with aphidicolin (APH). Both samples derive from RPE-1 cells after CenRICH with SNE enzyme combination. Each dot represents one image with an average of ~8 fibers. Error bars represent SEM. Mann Whitney test, p = 0.0095. F. Box and whiskers plot showing fork velocity (expressed as Kb/minute) as measured from the CldU incorporation rate. Same samples as E. Whiskers range from minimum to maximum values. Box is showing the 25, 50 and 75% percentile. n = 59 and 44 for NT and APH respectively. Mann Whitney test, p < 0.0001.

