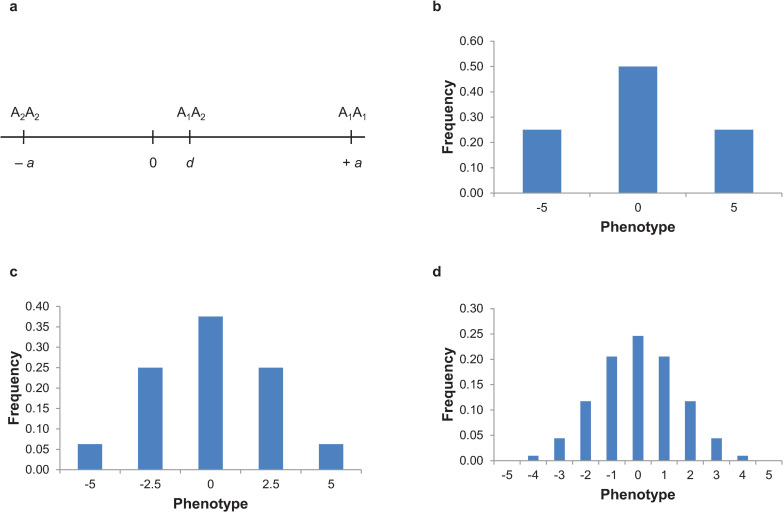
Fig 1. Fisher’s reconciliation of Mendel’s laws of inheritance with continuous variation for quantitative traits.
(a) Fisher generalized Mendel’s phenotypes that have “a sharp and certain separation” [1] at a single locus for any phenotypic difference and any degree of dominance [4]. He centered the difference in phenotypes between the 2 homozygous genotypes at 0, so the genotype increasing the trait value has an effect of +a and the genotype decreasing the trait value has an effect of −a, where a is the additive effect. He defined the effect of the heterozygote, d (the dominance effect), as the difference between the average phenotype of heterozygotes and the average of the 2 homozygotes. (b) Fisher then assumed that each locus affecting a quantitative trait segregates in natural populations, with the frequencies p and q (q = 1–p) for the A1 and A2 alleles, respectively. The frequencies of the genotypes or phenotypes are given by the binomial expansion of (p+q)n–1, where n is the number of genotypes or phenotypes. With random mating, the frequencies for genotypes A1A1, A1A2, and A2A2 at each locus are p2, 2pq, and q2, respectively. In this example, a = 5, d = 0, and p = q = 0.5, so the 3 genotypes have phenotypes of 5, 0, and −5 with frequencies of 0.25, 0.5, and 0.25. These values of p and q correspond to the frequency of the 2 alleles in Mendel’s crosses of F1 hybrids, with the expected genotype ratios of 1:2:1 in the F2, but are generalized to any phenotypic effects and allele frequencies. (c) Fisher then assumed that as more loci affect the trait, the phenotypic range remains the same, and that the effects of all loci are the same or nearly so and add together to give the observed phenotype. Thus, as the number of loci increases, the effects of each on the phenotype become smaller. This example is for 2 loci (A and B), each with 2 alleles, with the same values of a, d, p, and q for each locus as that for locus A in panel (b). There are 9 genotypes but only 5 phenotypes. (d) The distinction between phenotypes decreases even further as the number of loci increases, and nongenetic environmental effects result in truly continuous distributions of quantitative traits in natural populations. In this example, there are 5 loci (A, B, C, D, and E), each with 2 alleles, with the same values of a, d, p, and q for each locus as that for locus A in panel (b). There are 243 genotypes but only 11 phenotypes.

