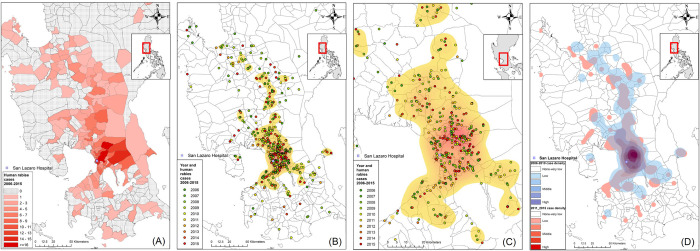
Fig 4. Geographical distributions of patient residential addresses among those admitted to San Lazaro Hospital with a final diagnosis of rabies between 2006 and 2015.
(A) Numbers of rabies cases in municipalities or cities. (B) Case mapping and heatmaps of rabies cases in Metro Manila, Region III, and Region IV-A. (C) Enlarged scale map focusing on cases and the heatmap in Metro Manila. (D) Heatmaps showing the case densities of human rabies cases during two observational periods (2006–2010 [transparent blue] and 2011–2015 [red]); each dot represents the residential address of a rabies case, with different colors representing the year of admission. Regional, provincial, city, and municipal boundary data and base maps were obtained from the United Nations Office for the Coordination of Human Affairs (OCHA). (https://data.humdata.org/dataset/philippines-administrative-levels-0-to-3).

