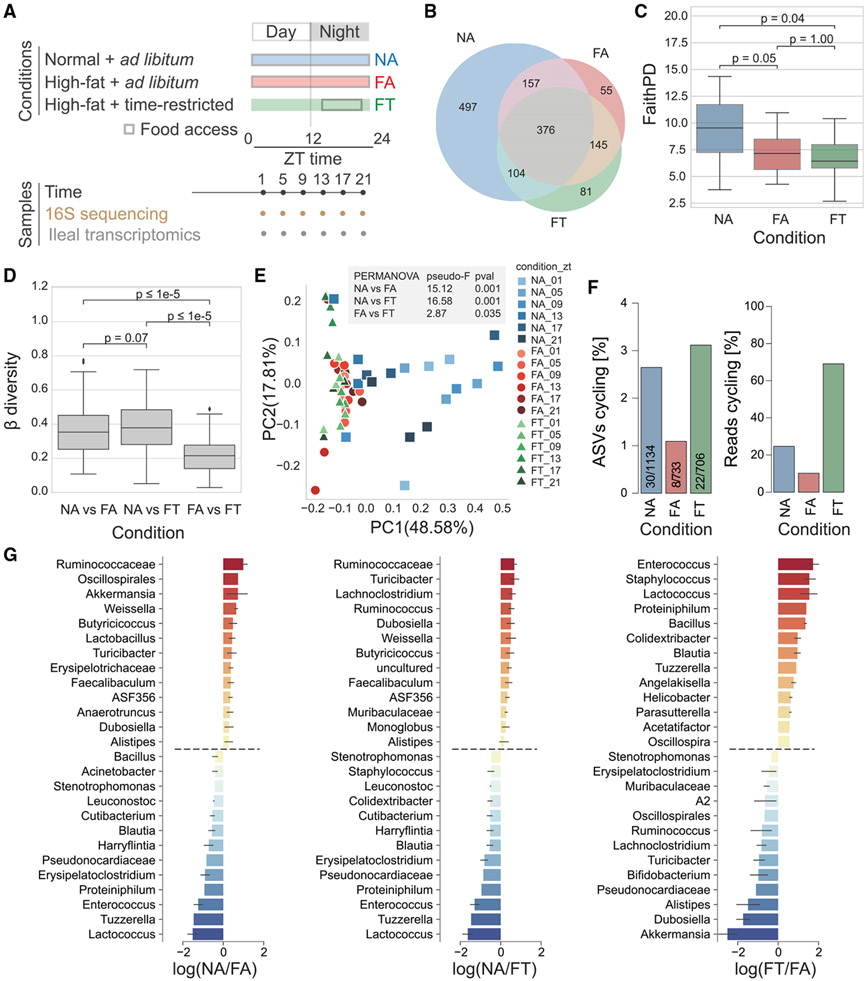
Figure 1. Microbiota diversity and cyclical pattern at the ileum.
(A) Schematic representation of study design and sample collection.
(B) Shared ASVs between conditions.
(C) Measures of α-diversity within each sample based on phylogenetic distance (Faith’s PD).
(D) Overall β-diversity across conditions time points.
(E) Principal coordinate analysis (PCoA) of ASVs colored by condition and collection time.
(F) Cycling (JTK_CYCLE algorithm, MetaCycle) based on the total number of ASVs or reads.
(G) Differential ranking between conditions as determined by Songbird. Statistical significance was assessed with the Mann-Whitney U test. *p < 0.05; **p < 0.01; ***p < 0.001; n.s., not significant. Three mice per time point were used for each condition, for a total of NA (n = 18), FA (n = 18), FT (n = 18).

