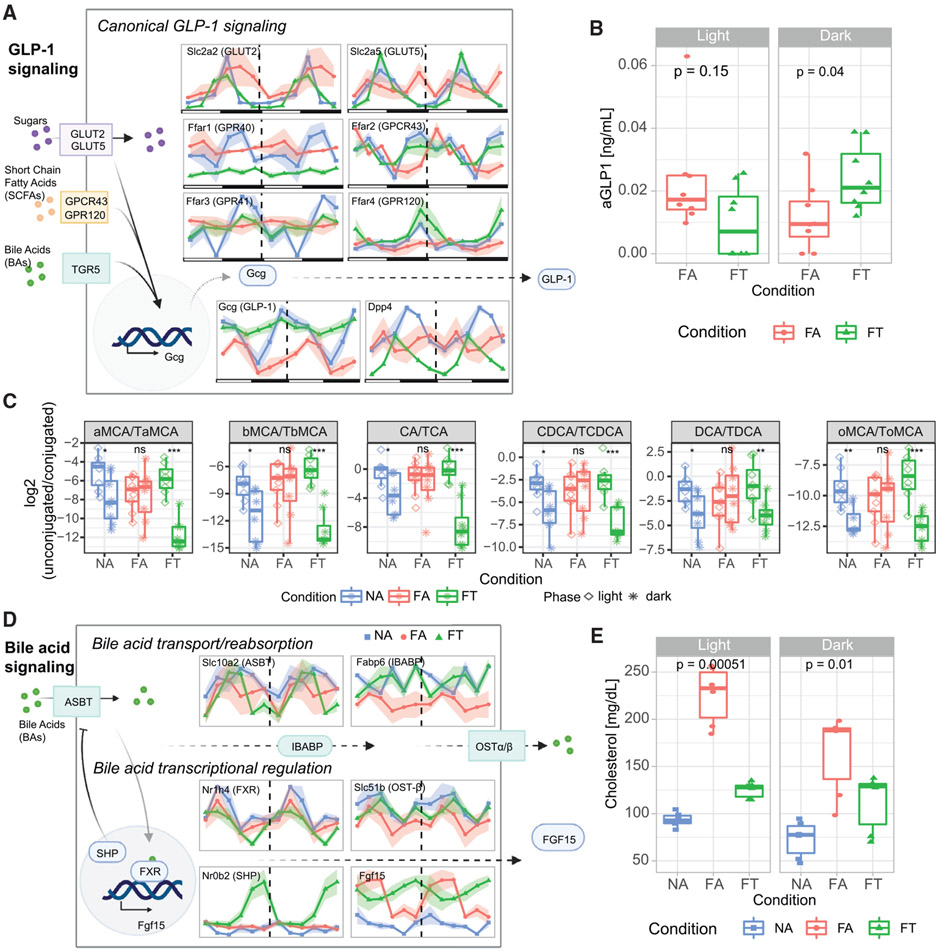
Figure 7. Disruption of metabolic signaling pathways of the ileum.
(A) Schematic representation of expression levels of GLP-1 signaling pathway genes.
(B) Plasma active GLP-1 (aGLP-1) levels in mice fed HFD under FA or FT conditions.
(C) Ratios of unconjugated to conjugated bile acids in light and dark phases for each condition.
(D) Schematic representation of expression levels of bile acid signaling pathway genes.
(E) Serum cholesterol levels under different feeding conditions. Transcript levels are expressed as TPM. Please see Figure S7 for figures with y axis measures. NA = blue, FA = red, FT = green. Three mice per time point were used for each condition, for a total of NA (n = 18), FA (n = 18), FT (n = 18) in (A) and (B). Shading areas show standard error of mean (SEM).

