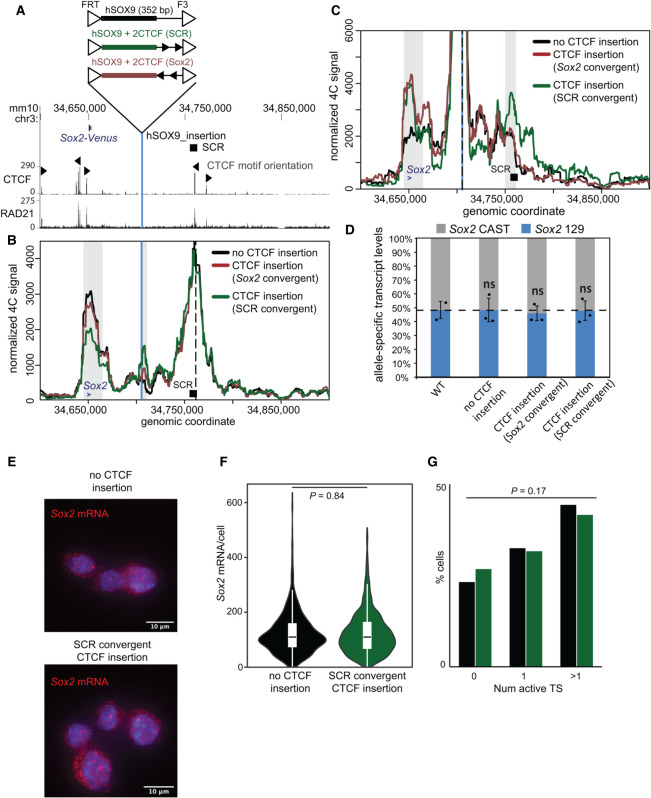
Figure 6.
A CTCF motif insertion between the Sox2 gene and the SCR disrupts the SCR–Sox2 gene interaction, but not SCR-mediated enhancer activity. (A) The region surrounding the Sox2 gene is displayed on the UCSC genome browser (mm10). The Sox2 control region (SCR) is shown along with the orientation of the CTCF motifs within CTCF-bound regions. The vertical blue line represents the location into which the sequences shown above were integrated. CTCF and RAD21 ChIP-seq conducted in ESCs is shown below. In B and C, 4C data are shown for no CTCF integration (black), CTCF sites integrated in an orientation convergent with the SCR site (green), and CTCF sites integrated in an orientation convergent with the Sox2 site (brown). The vertical blue line represents the location into which the sequences were integrated, and the dashed line marks the location of the 4C bait at the SCR (B) or the integration site (C). Gray boxes indicate the bait-interacting regions where significant differences were identified surrounding the Sox2 gene (blue arrow), SCR (black box), or integration site (blue line). Compared with control cells lacking CTCF at the insertion site, a significant decrease in relative interaction frequency of the 4C bait region at the SCR with the Sox2 gene was observed in the SCR-convergent CTCF insertion (P = 0.002), but not the Sox2-convergent CTCF insertion (P = 0.1). Compared with control cells, a significant increase in relative interaction frequency of the 4C bait region at the insertion with the Sox2 gene site was observed in the SCR-convergent CTCF insertion (P = 0.02) and the Sox2-convergent CTCF insertion (P = 0.005). A significant increase in relative interaction frequency of the 4C bait region at the insertion with the SCR was observed in the SCR-convergent CTCF insertion (P = 0.02) but not the Sox2-convergent CTCF insertion (P = 0.6). (D) Allele-specific primers detect Sox2 musculus (129) or castaneus (CAST) mRNA by RT-qPCR from F1 ESC clones from the genotype indicated. Expression levels from either allele are shown relative to the total transcript levels. Error bars represent SD. n = 2–3. (ns) Not significant (P > 0.05). (E) Maximal projections of representative micrographs from smFISH experiments performed on ESCs with only the control sequence, or with the control sequence and CTCF sites convergent with the SCR, introduced at the insertion site. Sox2 mRNA molecules are labeled in red, with DAPI staining in blue. Scale bar, 10 μm. (F) Violin plot comparing distributions of Sox2 mRNA molecules per cell in ESCs with only the control sequence (black; n = 819 cells from two replicates), or the control sequence plus CTCF sites convergent with the SCR (green; n = 1289 cells from two replicates), at the insertion site. (G) Proportions of cells with zero, one, or more than one active transcription sites (TSs) for ESCs with only the control sequence (black), or the control sequence plus CTCF sites convergent with the SCR (green), at the insertion site.

