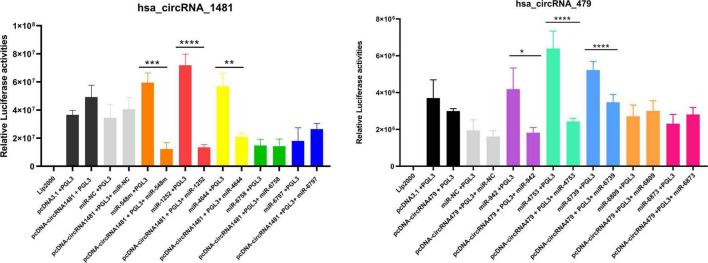
FIGURE 10.
The relative luciferase activities of hsa_circRNA_1481 and hsa_circRNA_000479 showing the expression level of each miRNA. The relative luciferase activities were calculated in HEK293T cells co-transfected by five miRNA mimics are depicted in the bar graph (*P < 0.05, **P < 0.01, ***P < 0.001, and ****P < 0.0001). Experimental results are expressed as mean ± standard error.

