
Figure 2. HD diet results in reduction of interpersonal variation in hippuric acid but not other uMDMs.
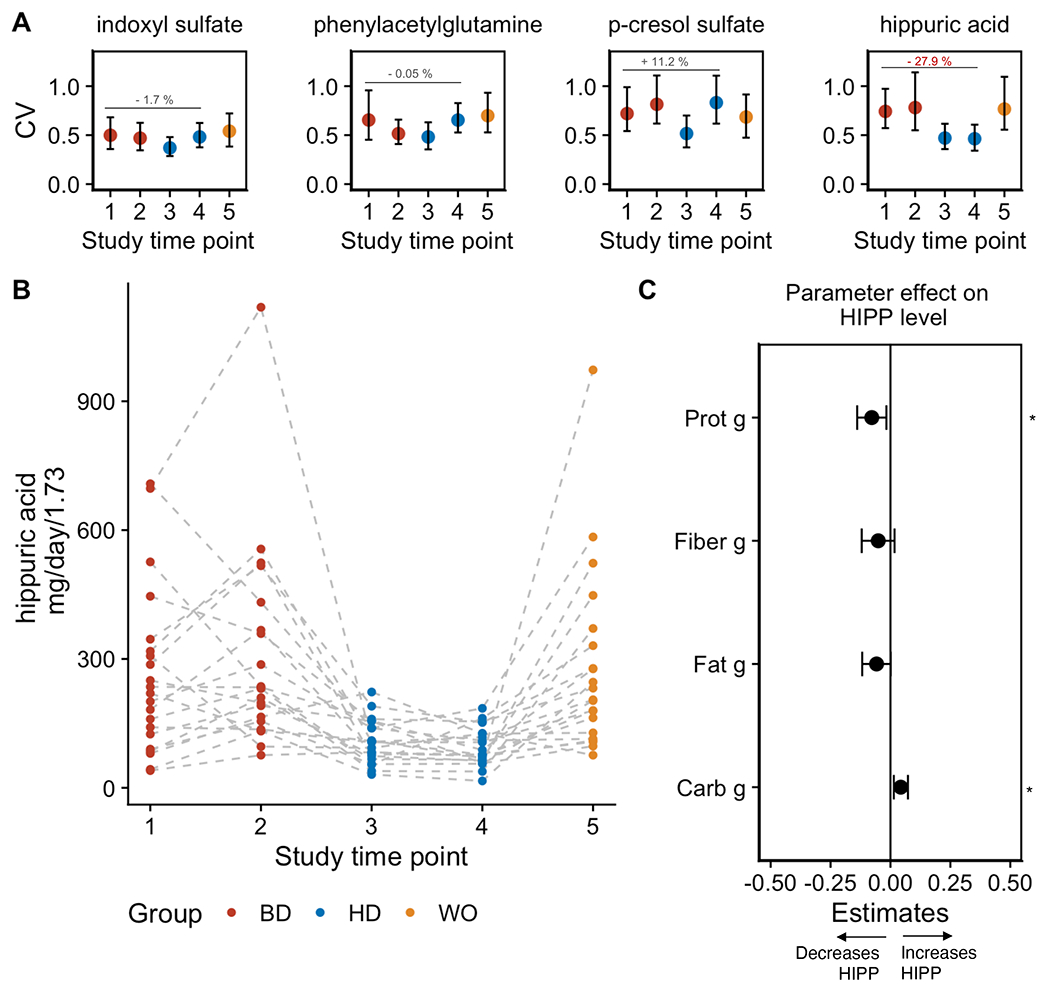
(A) Coefficient of variation (CV) with 95 % confidence interval in urine uremic solutes indoxyl sulfate (IS), phenylacetylglutamine (PAG), p-cresol sulfate (PCS) and hippuric acid (HIPP) at study time points across the BD, HD, and WO phases. Error bars represent 25th (bottom) and 75th (upper) quartiles.
(B) Urine levels of hippuric acid (HIPP) determined by targeted LC-MS during the baseline diet (BD), homogenous diet (HD) and wash out (WO) (****p < 0.0001; paired Wilcoxon signed rank test).
(C) Effect sizes of dietary macronutrients quantified by a mixed-effects model at time point 4 (along with a 95% CI) show that carbohydrates (p = 0.01) support higher levels of hippuric acid (HIPP), whereas total protein (p = 0.02) detracts from HIPP levels. Asterisks (*) indicate significant of specific parameters included in the model.