. 2021 Oct 5;12(1):154–171. doi: 10.1158/2159-8290.CD-21-0291

Figure 1.

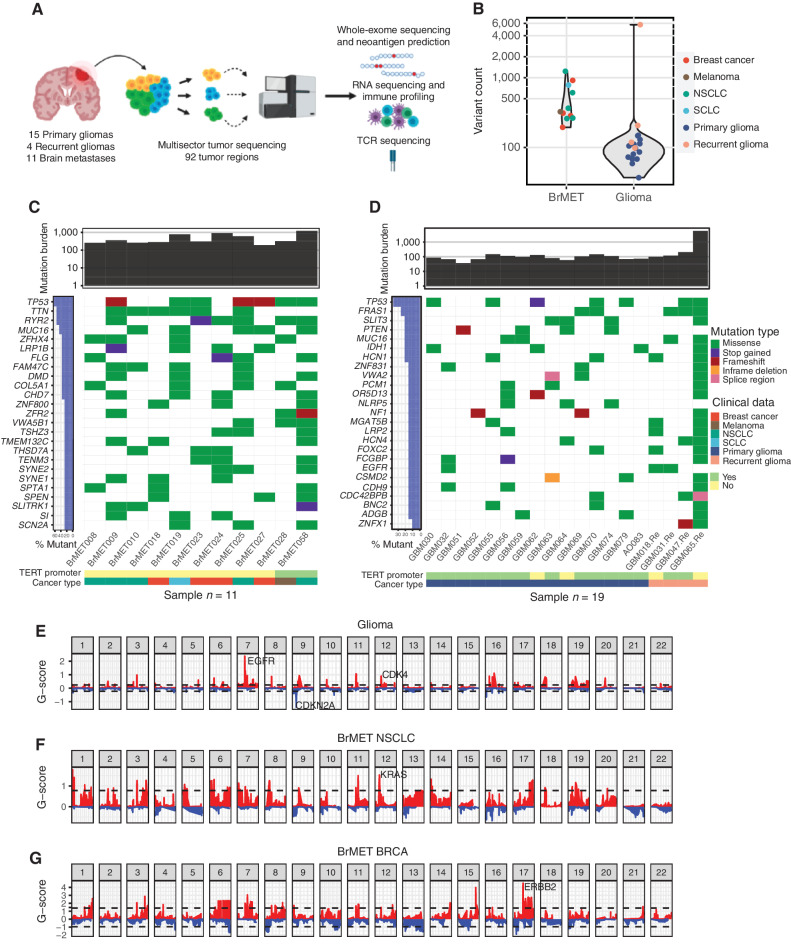
Figure 1. Genomic landscape of brain tumor cohort. A, Overview of sample collection, sequencing, and data analysis. B, Variant counts per tumor pooled across samples. C, Summary of top 25 recurrently mutated genes (3 or more tumors) in 11 brain metastases. D, Summary of recurrently mutated genes (3 or more tumors) in 19 primary and recurrent gliomas. E, Cohort-level copy number variation in gliomas determined by the GISTIC algorithm. Dashed lines indicate significantly recurrent amplifications (red) and deletions (blue) at an FDR <0.1. F, NSCLC brain metastasis cohort GISTIC output. G, Breast cancer brain metastasis cohort GISTIC output. SCLC, small cell lung cancer.

Genomic landscape of brain tumor cohort. A, Overview of sample collection, sequencing, and data analysis. B, Variant counts per tumor pooled across samples. C, Summary of top 25 recurrently mutated genes (3 or more tumors) in 11 brain metastases. D, Summary of recurrently mutated genes (3 or more tumors) in 19 primary and recurrent gliomas. E, Cohort-level copy number variation in gliomas determined by the GISTIC algorithm. Dashed lines indicate significantly recurrent amplifications (red) and deletions (blue) at an FDR <0.1. F, NSCLC brain metastasis cohort GISTIC output. G, Breast cancer brain metastasis cohort GISTIC output. SCLC, small cell lung cancer.