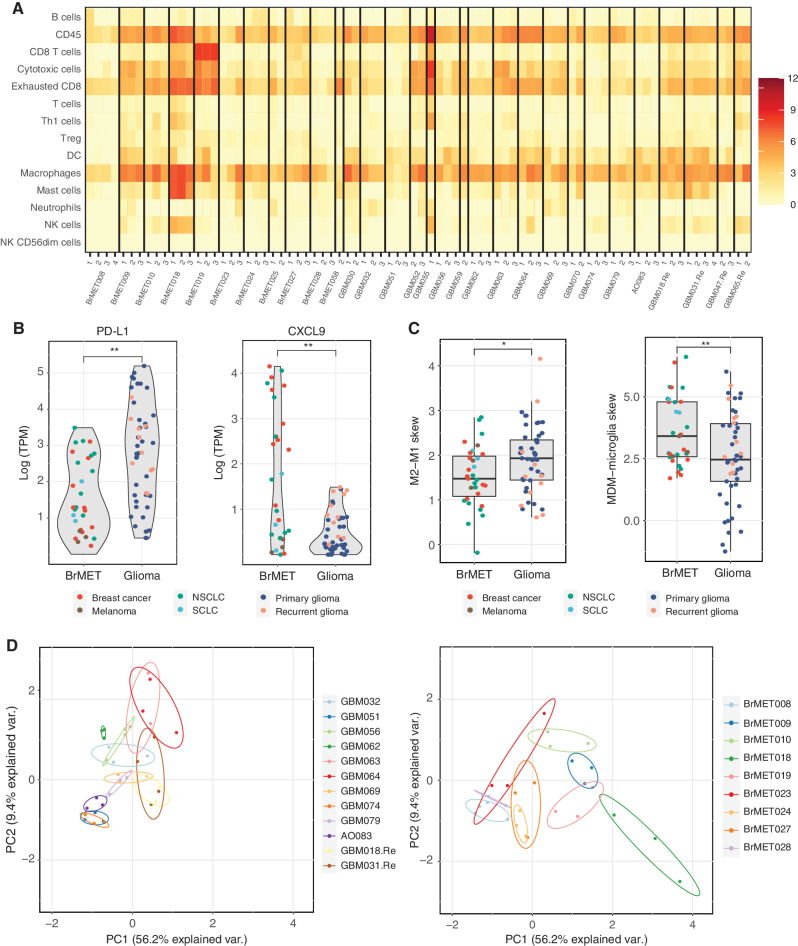
Figure 4.
Spatial diversity of the immune microenvironment. A, Heat map of the immune cell scores for all samples as estimated by the method from Danaher and colleagues (42). Each column represents a tumor region and each row represents an immune population. Scores represent the average of the log-transformed expression of a collection of subset-specific genes. B, Difference in log-transformed expression of PD-L1 (left) and CXCL9 (right) between tumor types for all samples within cohort. Significance determined by t test with Benjamini–Hochberg multiple test correction. **, q < 0.01. C, Difference in macrophage polarization (left) or ontogeny (right) based on previously published gene sets (see Methods) between tumor types for all samples within the cohort. Significance determined by two-sided t test. *, P < 0.05; **, P < 0.01. D, Danaher scores for each sector from a tumor with three or more samples plotted in PC1–PC2 space following principal components analysis. DC, dendritic cell; NK, natural killer; Treg, regulatory T cell.

