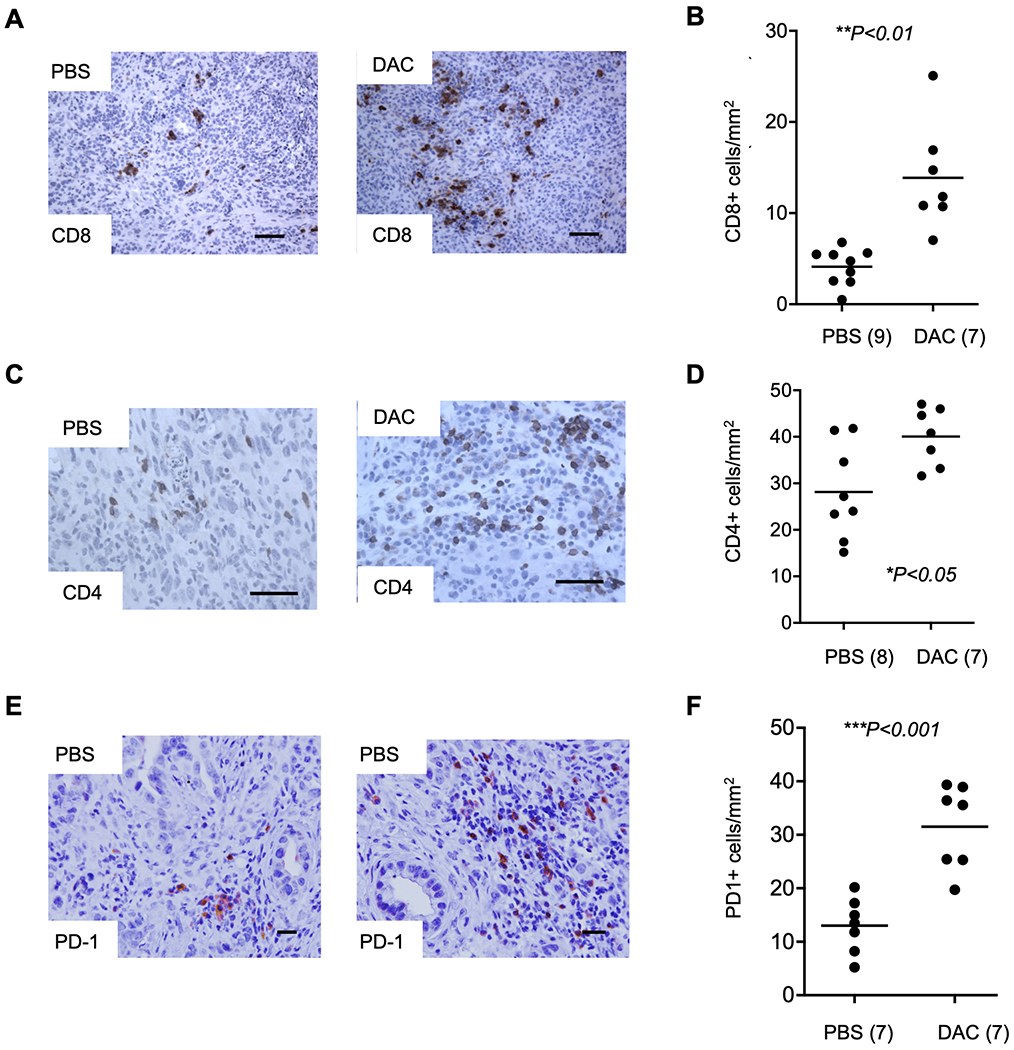
Figure 2. DAC treatment increases tumor-infiltrating CD8+ and CD4+ lymphocytes and PD-1 expressing cells.

(A) IHC showing an increase in CD8+ TILs with DAC treatment compared to PBS vehicle. (B) Cell counting reveals a significant increase in CD8+ TILs following DAC treatment. (C) IHC images of CD4+ TILs with DAC compared to PBS. (D) Cell counting reveals an increase in the number of CD4+ cells between DAC and PBS treated tumors. (E) IHC shows that the number of PD-1 positive cells is increased by DAC. (F) The increase in PD-1+ cells is confirmed by cell counting. Data are from treatment Paradigm I. The number of cases for cell counting are indicated in parentheses and reflect the number of histological blocks available. Original magnification, 20X; scale bars, 100 μm.
