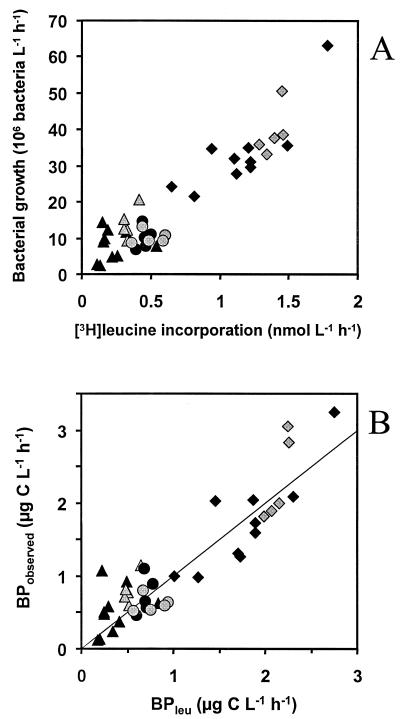
FIG. 3.
(A) Leucine incorporation versus change in bacterial abundance (y = 27.79 · x + 0.77 and r2 = 0.86 for the anoxic samples; y = 26.96 · x + 1.17 and r2 = 0.86 for the oxic samples [linear regression]). (B) Bacterial production from the leucine incorporation (BPleu) versus observed biomass change (BPobserved) (y = 0.90 · x + 0.15 and r2 = 0.82 for the anoxic samples; y = 1.05 · x + 0.05 and r2 = 0.84 for the oxic samples [linear regression]). Grey and black symbols denote oxic and anoxic conditions, respectively. Triangles, circles, and squares represent experiments with water from Illersjön, Lillsjön, and Mårn, respectively (see text for information about lakes). The line corresponds to the 1:1 relationship.

