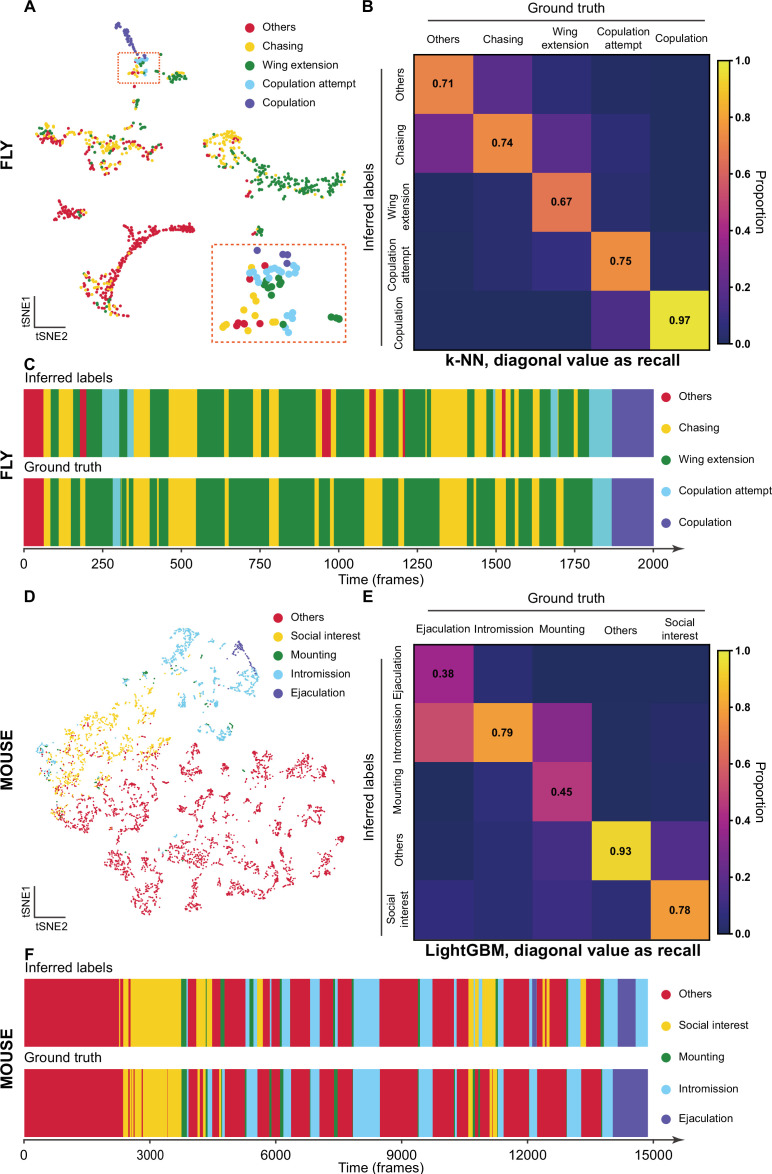
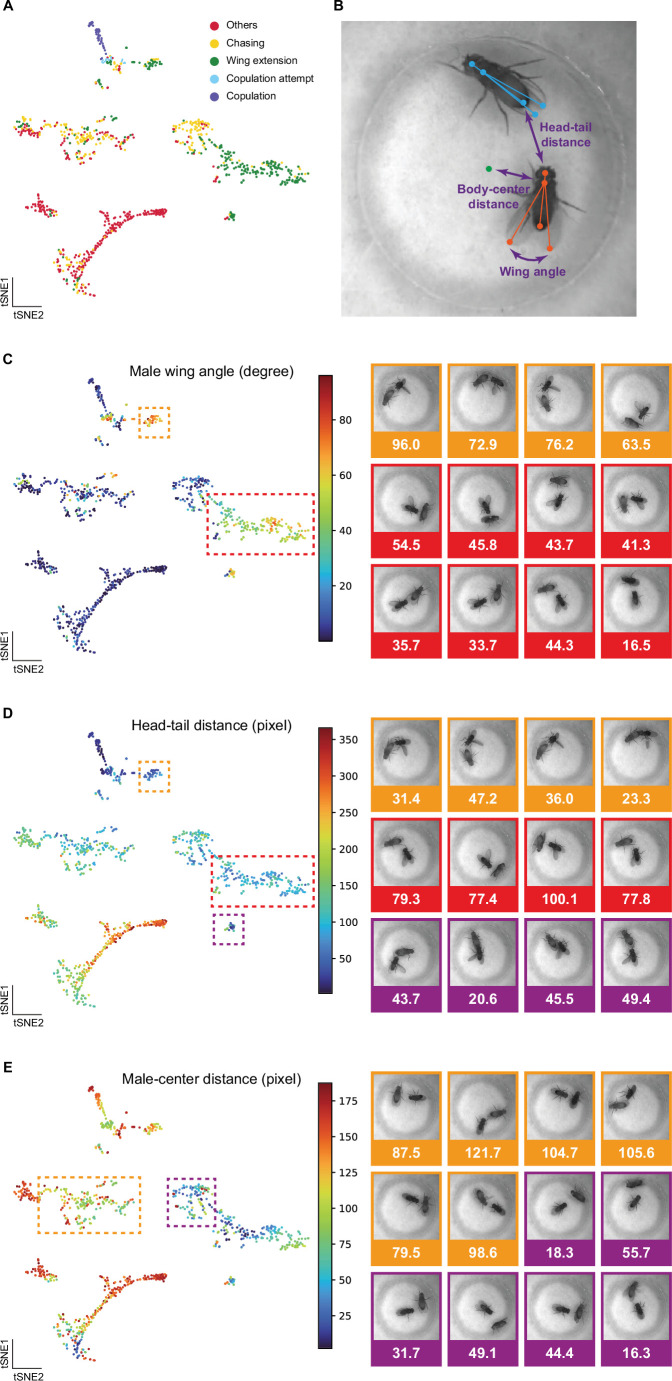
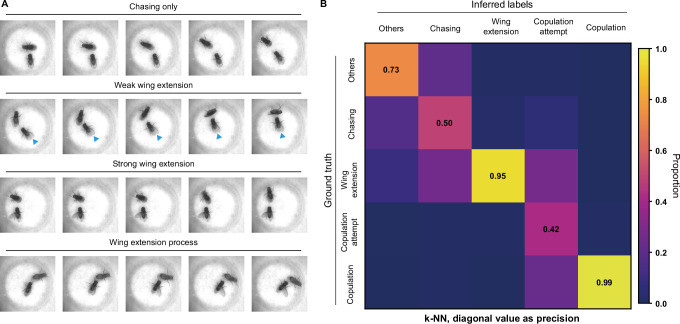
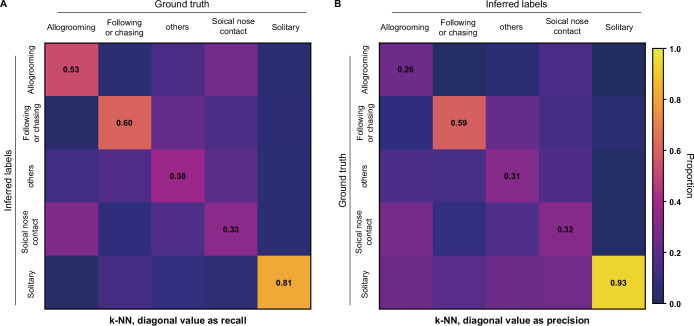
Figure 3. The validation of Selfee (Self-supervised Features Extraction) with human annotations.
(A) Visualization of fly courtship live-frames with t-SNE dimension reduction. Each dot was colored based on human annotations. Points representing chasing, wing extension, copulation attempt, copulation, and non-interactive behaviors (‘others’) were colored with yellow, green, blue, violet and red, respectively. (B) The confusion matrix of the k-NN classifier for fly courtship behavior, normalized by the numbers of each behavior in the ground truth. The average F1 score of the sevenfold cross-validation was 72.4%, and mAP was 75.8%. The recall of each class of behaviors was indicated on the diagonal of the confusion matrix. (C) A visualized comparison of labels produced by the k-NN classifier and human annotations of fly courtship behaviors. The k-NN classifier was constructed with data and labels of all seven videos used in the cross-validation, and the F1 score was 76.1% and mAP was 76.1%. (D) Visualization of live-frames of mice mating behaviors with t-SNE dimension reduction. Each dot is colored based on human annotations. Points representing non-interactive behaviors (‘others’), social interest, mounting, intromission, and ejaculation were colored with red, yellow, green, blue, and violet, respectively. (E) The confusion matrix of the LightGBM (Light Gradient Boosting Machine) classifier for mice mating behaviors, normalized by the numbers of each behavior in the ground truth. For the LightGBM classifier, the average F1 score of the eightfold cross-validation was 67.4%, and mAP was 69.1%. The recall of each class of behaviors was indicated on the diagonal of the confusion matrix. (F) A visualized comparison of labels produced by the LightGBM classifier and human annotations of mice mating behaviors. An ensemble of eight trained LightGBM was used, and the F1 sore was 68.1% and mAP was not available for this ensembled classifier due to the voting mechanism.

