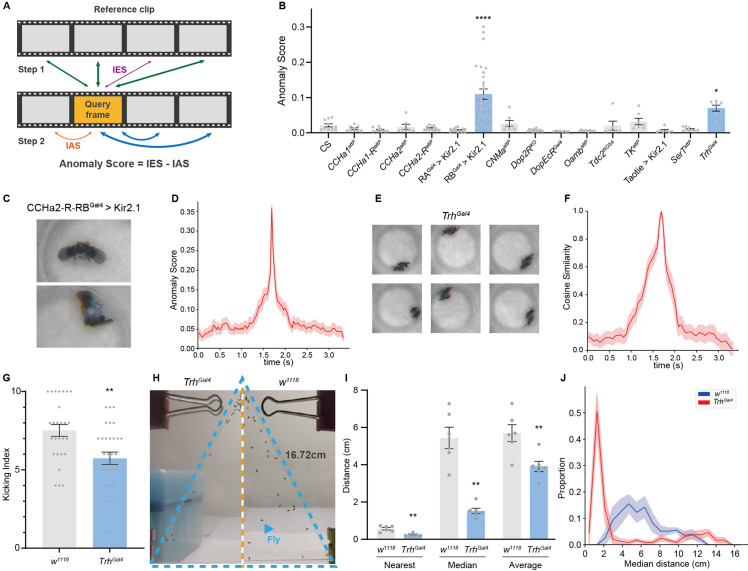
Figure 4. Anomalous posture detection using Selfee (Self-supervised Features Extraction)-produced features.
(A) The calculation process of anomaly scores. Each query frame is compared with every reference frame, and the nearest distance was named IES (the thickness of lines indicates distances). Each query frame is also compared with every query frame, and the nearest distance is called IAS. The final anomaly score of each frame equals IES minus IAS. (B) Anomaly detection results of 15 fly lines with mutations in neurotransmitter genes or with specific neurons silenced ( n = 10,9,10,7,12,15,29,7,16,8,8,6,7,7,9,7, respectively). RA is short for CCHa2-R-RA, and RB is short for CCHa2-R-RB. CCHa2-R-RBGal4>Kir2.1, q<0.0001; TrhGal4, q=0.0432; one-way ANOVA with Benjamini and Hochberg correction. (C) Examples of mixed tussles and copulation attempts identified in CCHa2-R-RBGal4>Kir2.1 flies. (D) The temporal dynamic of anomaly scores during the mixed behavior, centralized at 1.67 s. SEM is indicated with the light color region. (E) Examples of close body contact behaviors identified in TrhGal4 flies. (F) The cosine similarity between the center frame of the close body contact behaviors (1.67 s) and their local frames. SEM is indicated with the light color region. (G) The kicking index of TrhGal4 flies (n=30) was significantly lower than w1118 flies (n=27), p=0.0034, Mann-Whitney test. (H) Examples of social aggregation behaviors of TrhGal4 flies and w1118 flies. Forty male flies were transferred into a vertically placed triangle chamber (blue dashed lines), and the photo was taken after 20 min. A fly was indicated by a blue arrow. The lateral sides of the chamber were 16.72 cm. (I) Social distances of TrhGal4 flies (n=6) and w1118 flies (n=6). TrhGal4 flies had much closer social distances with each other compared with w1118 flies; nearest, p=0.0043; median, p=0.002; average, p=0.0087; all Mann-Whitney test. (J) Distributions of the median social distance of TrhGal4 flies and w1118 flies. Distributions were calculated within each replication. Average distributions were indicated with solid lines, and SEMs were indicated with light color regions.


