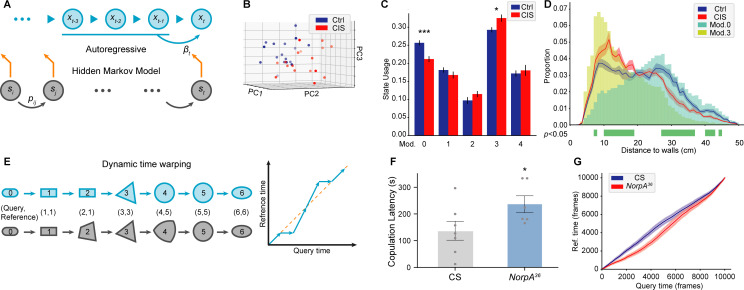
Figure 5. Time-series analyses using Selfee (Self-supervised Features Extraction)-produced features.
(A) A brief illustration of the autoregressive hidden Markov model (AR-HMM). The local autoregressive property is determined by βt, the autoregressive matrix, which is yield based on the current hidden state of the HMM. The transition between each hidden state is described by the transition matrix (pij). (B) Principal component analysis (PCA) visualization of state usages of mice in control groups (n=17, blue points) and chronic immobilization stress (CIS) groups (n=17, red points). (C) State usages of 10 modules. Module No.0 and No.3 showed significantly different usages in wild-type and mutant flies; p=0.00065, q=0.003 and p=0.015, q=0.038, respectively, Mann-Whitney test with Benjamini and Hochberg correction. (D) The differences spotted by the AR-HMM could be explained by the mice’s position. Mice distances to the two nearest walls were calculated in each frame. Distance distributions (the bin width was 1 cm) throughout open-field test (OFT) experiments were plotted in solid lines, and SEMs were indicated with light color regions. Green blocks indicated bins with statistic differences between the CIS group and control groups. Frames assigned to modules No.0 and No.3 were isolated, and their distance distributions were plotted in blue and yellow bars, respectively. Frames of module No.0 were enriched in bins of larger values, while frames of module No.3 were enriched in bins of smaller values. (E) A brief illustration of the dynamic time warping (DTW) model. The transformation from a rounded rectangle to an ellipse could contain six steps (gray reference shapes). The query transformation lags at step 2 but surpasses at step 4. The dynamic is visualized on the right panel. (F) NorpA36 flies (n=6) showed a significantly longer copulation latency than wild-type flies (n=7), p=0.0495, Mann-Whitney test. (G) NorpA36 flies had delayed courtship dynamics than wild-type flies with DTW visualization. Dynamic of wild-type flies and NorpA mutant flies were indicated by blue and red lines, respectively, and SEMs were indicated with light color regions. The red line was laid below the blue line, showing a delayed dynamic of NorpA mutant flies.

