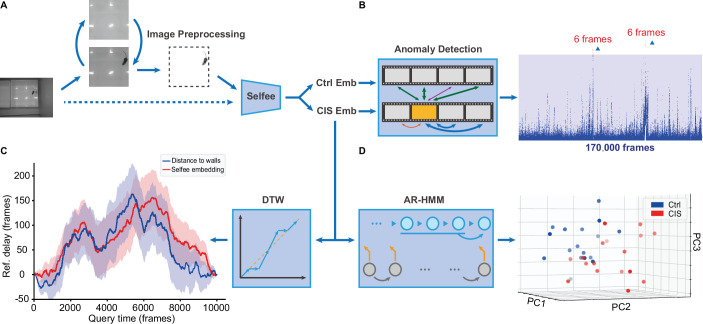
Figure 6. Application of the Selfee (Self-supervised Features Extraction) pipeline to mice open-field test (OFT) videos.
(A) Image preprocessing for Selfee. The area of the behavior chamber was cropped, and the background was extracted. Illumination normalization was performed after background subtraction. This preprocessing could be skipped if the background was consistent in each video, as our pipeline for fly videos (dashed lines). (B) Anomaly detection of mice OFT videos after chronic immobilization stress (CIS) experiences. Only 12 frames (red points, indicated by arrows) were detected based on a threshold constructed with control mice (the blue region), and anomaly scores were slightly higher than the threshold. (C) Dynamic time warping (DTW) analysis of mice OFT videos after CIS experiences. The dynamic difference between control groups and CIS groups was visualized, and positive values indicated a delay of the reference (control groups). Results from Selfee features and animal positions were similar (red and blue lines, respectively). (D) Autoregressive hidden Markov model (AR-HMM) analysis of mice OFT videos after CIS experiences. Principal component analysis (PCA) visualization of state usages of mice in control groups (n=17, blue points) and CIS groups (n=17, red points). Same as Figure 5B.
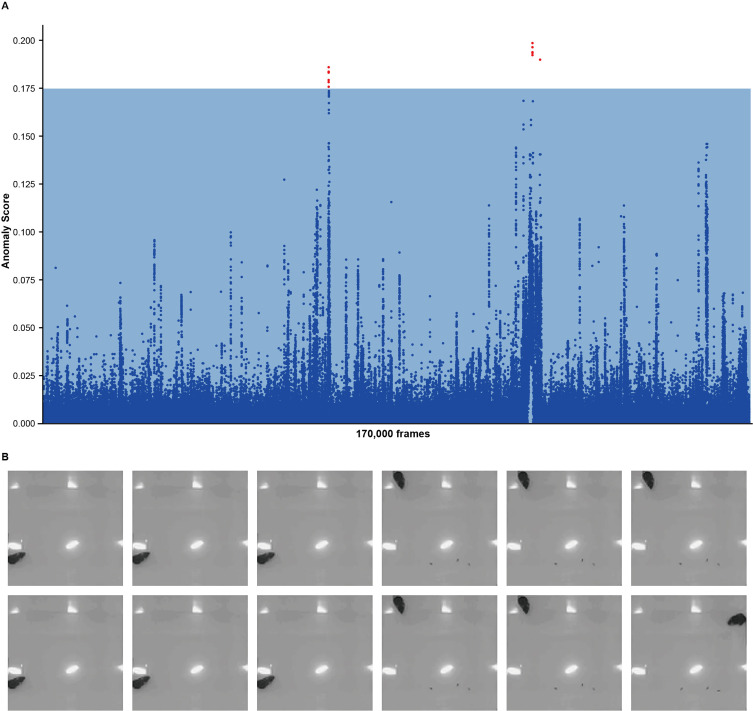
Figure 6—figure supplement 1. Anomaly detection of chronic immobilization stress (CIS) mice.
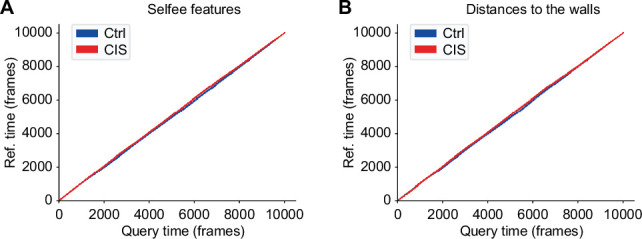
Figure 6—figure supplement 2. Dynamic time warping (DTW) analysis of chronic immobilization stress (CIS) and control mice.


