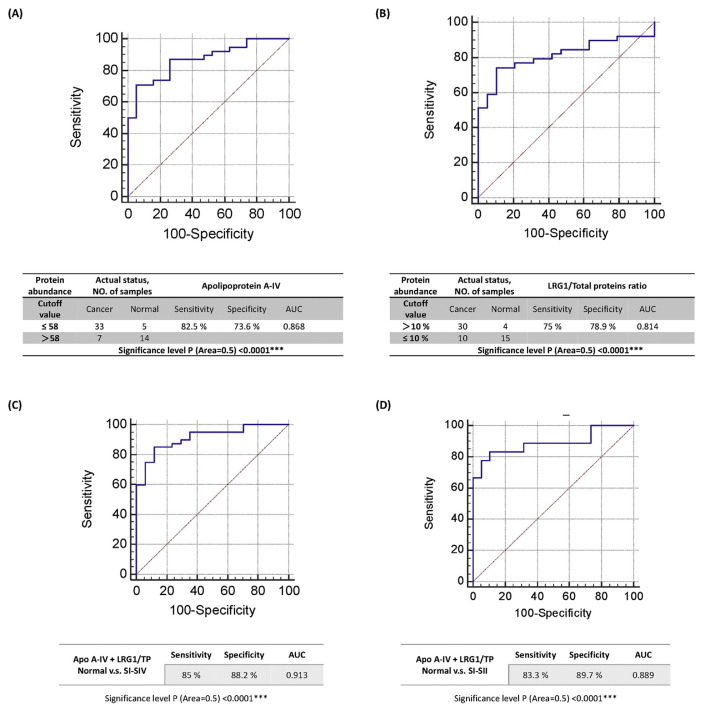
Fig. 2.
The ROC curve and diagnostic performance of (A) apolipoprotein A-IV, (B) the LRG1 to total protein ratio, (C) the ROC curve and the diagnostic performance of combining apolipoprotein A-IV with LRG1 relative to the total proteins ratio, and (D) the ROC curve and the diagnostic performance of combining apolipoprotein A-IV and LRG1 relative to the total protein ratio in differentiating the normal group from early cancer stages.

