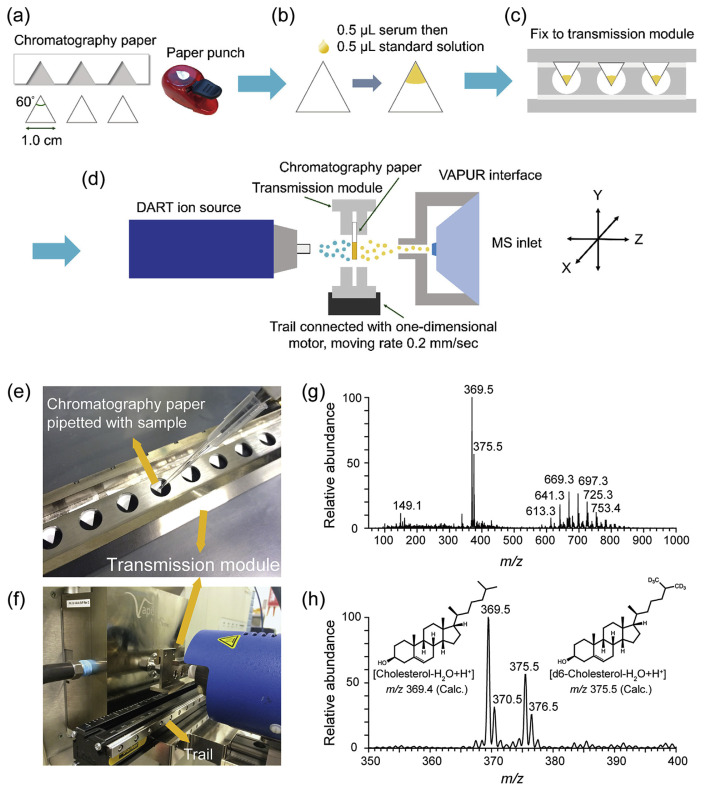
Fig. 6.
Workflow of pDART-MS for serum cholesterol quantification: (a) cutting chromatography papers, (b) loading sample and internal standard onto paper, (c) fixing paper substrate with loaded sample on the transmission module, (d) scanning across the samples. Experimental setup of pDART-MS: (e) and (f). Typical mass spectra of serum samples: (g) positive ion mode spectrum of a mixture of serum sample and cholesterol-D6, (h) magnification of the mass spectrum. Adapted with permission from Ref. [41].

