Figure 3.

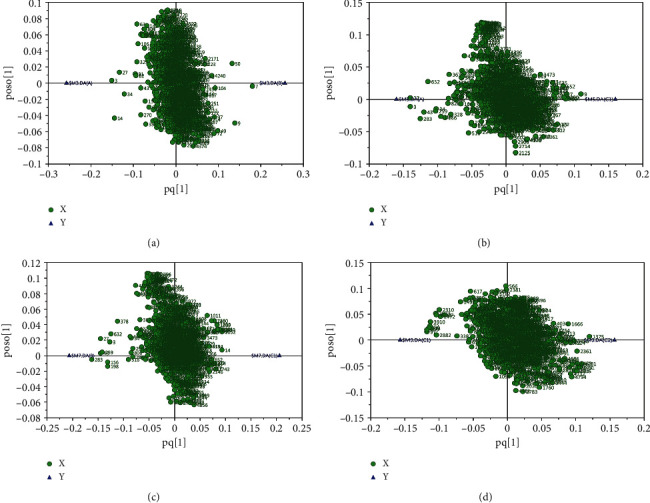
Loading plot of OPLS-DA model obtained from experimental groups (POS). (a) HC versus SCAD, (b) HC versus PR-ACS, (c) SCAD versus PR-ACS, and (d) PR-ACS versus PO-ACS.

Loading plot of OPLS-DA model obtained from experimental groups (POS). (a) HC versus SCAD, (b) HC versus PR-ACS, (c) SCAD versus PR-ACS, and (d) PR-ACS versus PO-ACS.