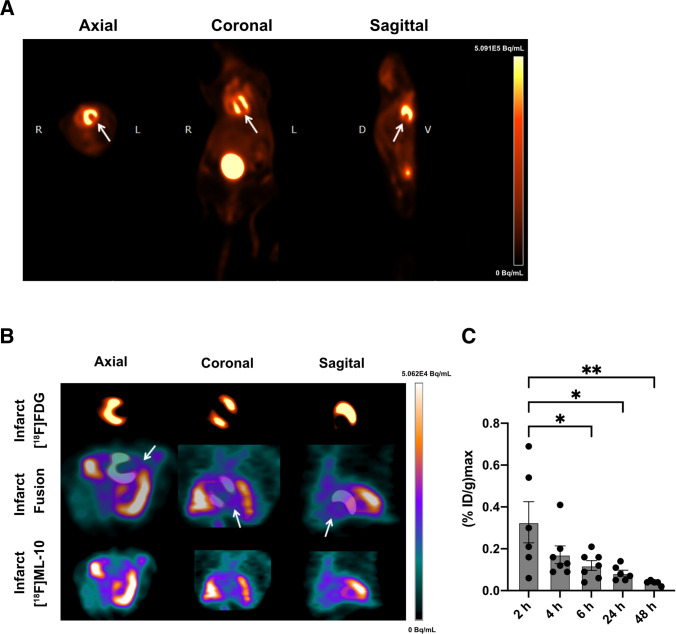
Fig. 2.
[18F]FDG and [18F]ML-10 PET imaging after MI. (A) Representative [18F]FDG image illustrating the MI. Arrows indicate the infarct area of the left ventricle. R right, L left, D dorsal, V ventral. Color scale: Volcano. (B) Representative images of [18F]FDG and [18F]ML-10 after permanent LAD ligation. Arrows indicate infarct area detected by diminished [18F]FDG uptake and evident [18F]ML-10 uptake. Color scale: Ocean. (C) Quantification of the injected dose per gram of [18F]ML-10 after different time points. N = 5–7. Data represent mean ± SEM. * p < 0.05, ** p < 0.01, *** p < 0.001

