Fig. 3.
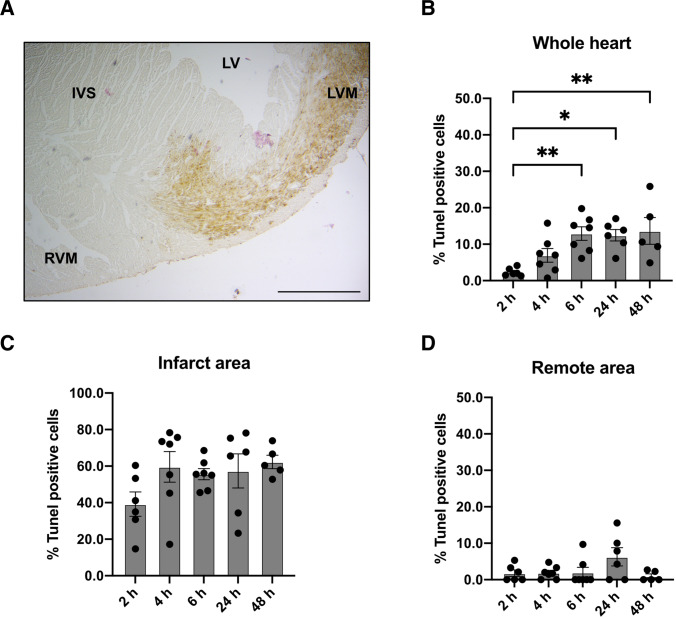
Histological evaluation by TUNEL staining after MI. (A) TUNEL staining of the heart after MI. Right ventricular myocardium (RVM), interventricular septum (IVS), left ventricle LV, left ventricular myocardium (LVM). Bar equals 500 μm. (B) Quantification of TUNEL positive cells in the whole heart after different time points. N = 5–7. (C) Quantification of TUNEL positive cells in the infarct area after different time points. N = 5–7. (D) Quantification of TUNEL positive cells in the remote area after different time points. N = 5–7. Data represent mean ± SEM. * p < 0.05, ** p < 0.01, *** p < 0.001

