
FIG. 2.
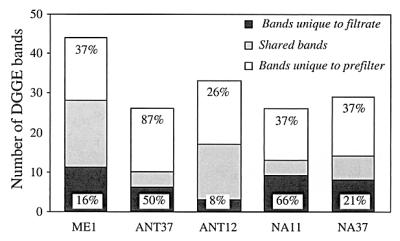
Numbers of bands that were unique to the filtrates, that were shared, and that were unique to the prefilters for the five samples used to generate genetic libraries after quantitative analysis of the DGGE gel shown in Fig. 1. The values above the bars for unique bands are the percentages of band intensity accounted for by these bands in the DGGE profile.