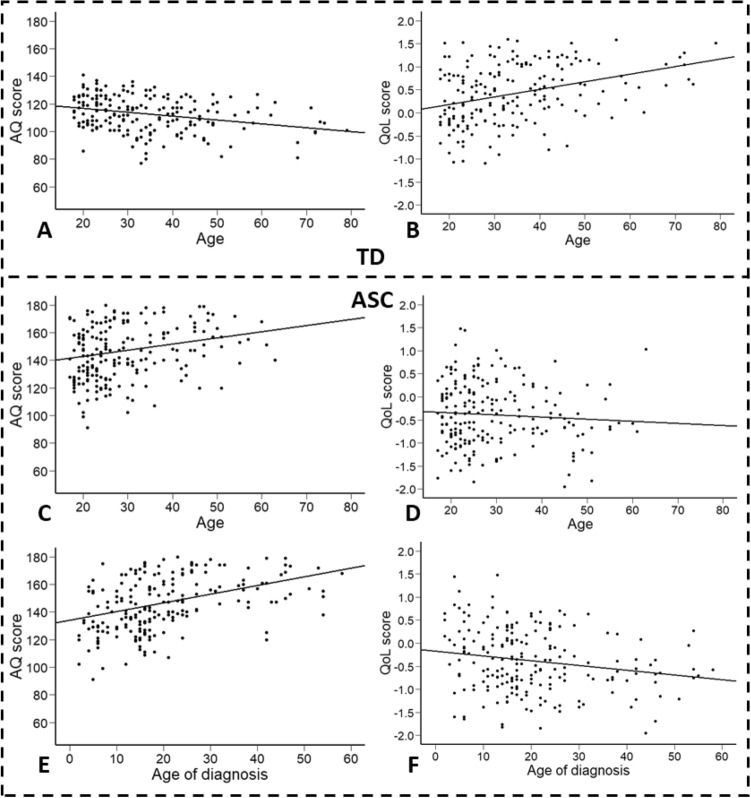
Fig. 2.
Scatter plots showing the relationship between age, AQ and QoL Scores in the TD Group (Top Panels) and in the ASC Group (Middle Panels), and the relationship between age of diagnosis, AQ and QoL scores in the ASC group (Bottom Panels). Panel A Relationship between age and AQ scores in the TD group. Panel B Relationship between age and QoL scores in the TD group. Panel C Relationship between age and AQ scores in the ASC group. Panel D Relationship between age and QoL scores in the ASC group. Panel E Relationship between age of diagnosis and AQ scores in the ASC group. Panel F Relationship between age of diagnosis and QoL scores in the ASC group

