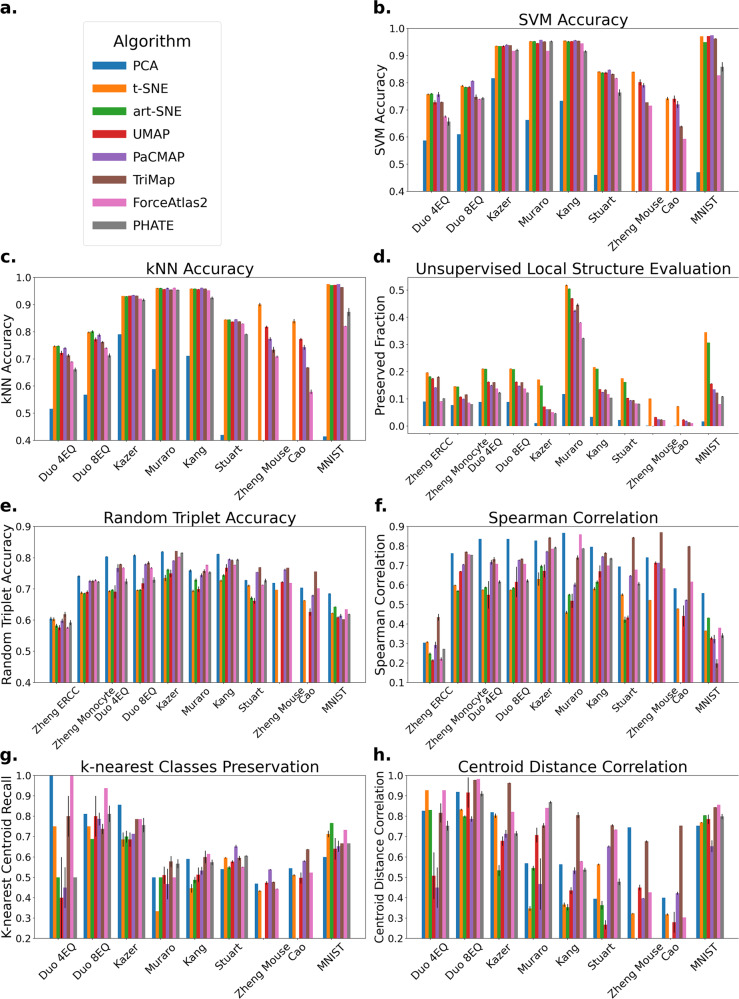
Fig. 3. Local and global structure evaluations.
Bar plots represent the average evaluation metrics across five runs for each algorithm with standard deviation shown as black error bars. Results of art-SNE and PHATE on Zheng Mouse and Cao are not included in this figure since they are unable to finish these large datasets under a time/memory budget—see the caption of Supplementary Table 4 for more information. Zheng ERCC and Zheng Monocyte are only used for unsupervised evaluation metrics. a Legend for all subfigures. b Local structure (supervised): SVM evaluation. Here methods that focus on local structure, such as t-SNE, art-SNE, UMAP, and PaCMAP, perform well. c Local structure: kNN evaluation. Similar to (b), t-SNE, art-SNE, UMAP, and PaCMAP perform well on this metric. d Local structure: proportion of neighborhood preserved. t-SNE and art-SNE achieved the best neighborhood preservation ability on the datasets. e Global structure: random triplet accuracy. TriMap, PaCMAP, and ForceAtlas2 perform well on this evaluation metric. f Global structure: distance Spearman correlation. Consistent with (e), here PCA, TriMap, PaCMAP and ForceAtlas2 perform well. g Global structure: k-nearest classes preservation. ForceAtlas2 and PCA perform the best on this metric. h Global structure: centroid distance correlation. On this metric, TriMap, and ForceAtlas2 perform well.

