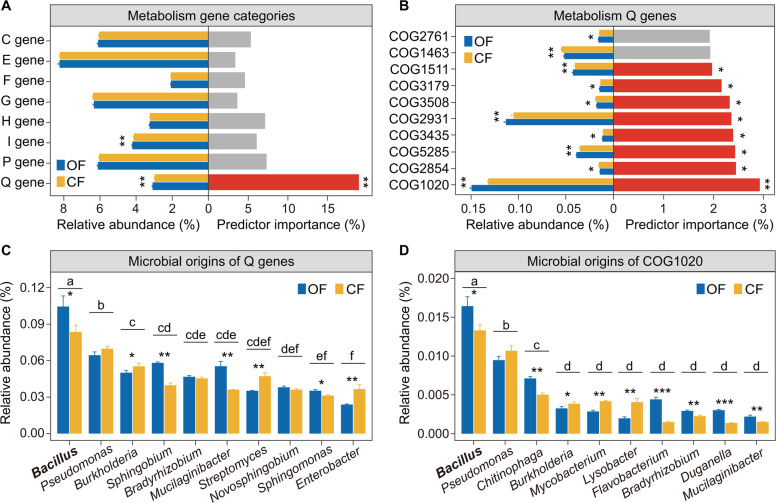
Fig. 3. Microbial functional genes and their potential interactions with pathogen density.
A The random forest mean predictor importance (% increase of the MSE) of the metabolism gene categories for Fusarium oxysporum density and the relative abundance of the metabolism gene categories in different fertilization treatments. B The top 10 most important random forest mean predictors (% increase of the MSE) of the Q gene category of Fusarium oxysporum density and the relative abundance of these genes in different fertilization treatments. C The top 10 microbial origins of metabolism Q genes. D The top 10 microbial origins of COG1020. In panels A, B, asterisks indicate significant differences of relative abundances as defined by the Student’s t test (*indicates p < 0.05, **indicates p < 0.01); for the random forest analysis, to estimate the importance of microbial predictors, we used the percentage increases in the MSE (mean squared error). In panels C, D, bars with different letters indicate significant differences as defined by one-way ANOVA with Tukey’s HSD test (p < 0.05). Asterisks indicate significant differences as defined by the Student’s t test (*indicates p < 0.05, **indicates p < 0.01, ***indicates p < 0.001). OF Organic fertilizer treatment; CF Chemical fertilizer treatment.

