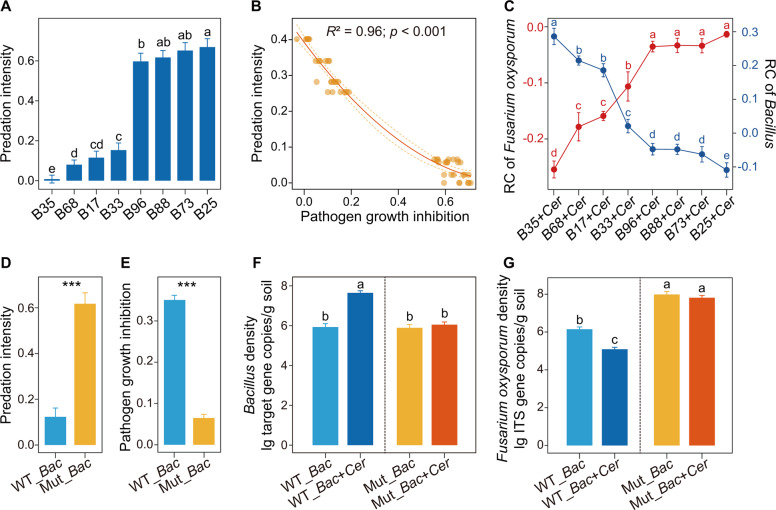
Fig. 5. Interactions between the pathogen, the bacterial isolates and the predator in the greenhouse experiment.
In panels A, C, F and G, bars with different letters indicate significant differences as defined by one-way ANOVA with Tukey’s HSD test (p < 0.05). In panels D, E, asterisks indicate significant differences as defined by the Student’s t test (***p < 0.001). Relative change = (X-control)/control, X = Bacillus + Cercomonas lenta, control = Bacillus only. B Bacillus isolate; Cer: Cercomonas lenta strain ECO-P-01. WT_Bac: wild type Bacillus strain. Mut_Bac: mutant Bacillus strain (disrupted in the bacillomycin D pathway) [54]. Predation intensity = (Yc–Yp)/Yc, where Yc is the Bacillus density in the control, and Yp is the Bacillus density in the Bacillus + Cercomonas lenta treatment [51].

