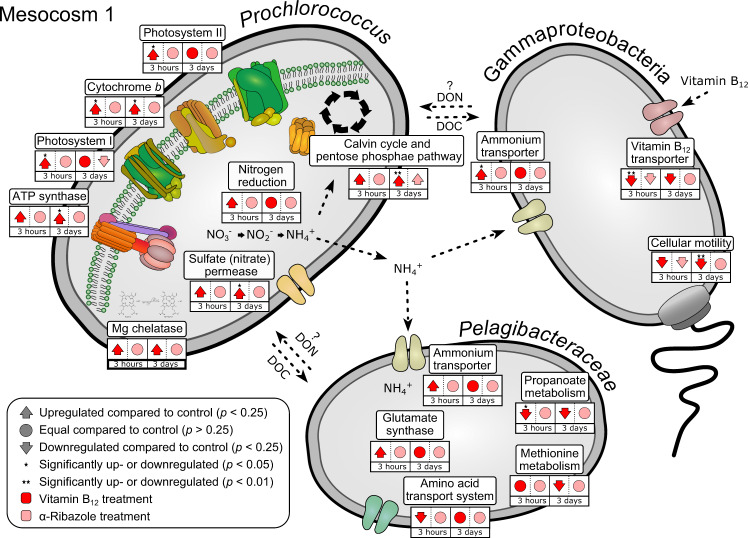
Fig. 6. Up- and downregulated transcripts of genes in Gammaproteobacteria, Pelagibacteraceae and Prochlorococcus encoding proteins of different functions in experiment M1.
Gammaproteobacteria (mainly SAR86 clade of Oceanospirillales), transporters of B12 and ammonium and cellular motility; Pelagibacteraceae, transporters of ammonium and amino acids, glutamate synthase, propanoate and methionine metabolism; Prochlorococcus, ATP synthase, photosystem I and II, cytochrome b, Magnesium chelatase, Calvin Benson cycle, pentose phosphate pathway, sulfate/nitrate permease, nitrate reduction. Genes associated to respective cellular functions were pooled and are shown in Supplementary Data 1. Dotted arrows indicate putative compounds released and exchanged among the three groups of organisms. Circles show no difference in the gene regulation between treatment and control, whereas arrows illustrate up- or downregulation (T-test, p < 0.25). Significant differences between treatment vs. control are highlighted by * (T-test, p < 0.05) and (T-test, p < 0.01). Red compares vitamin B12 treatment vs. control and pink compares α-ribazole vs. control.

