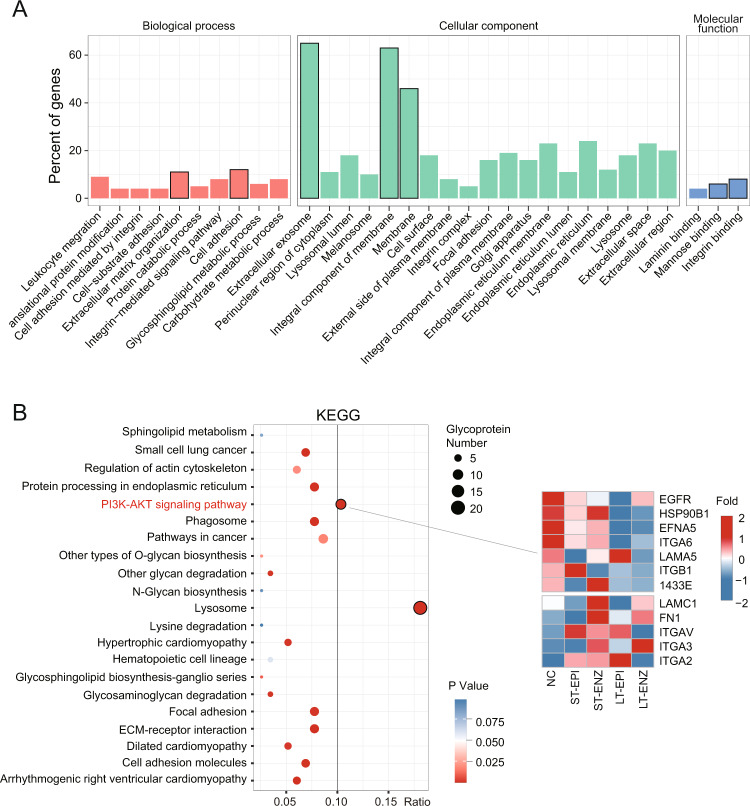
Fig. 4. PI3K-AKT pathway is enriched in the proteoglycomics dataset.
A Statistical distribution chart of differentially expressed glycoproteins under each GO category (2nd Level). The X-axis label is divided into three parts: biological process, cellular component, and molecular function. B KEGG pathway enrichment bubble plot of differentially expressed glycoproteins (left panel). The size and color of the bubbles reflect the glycoprotein counts and p value, respectively. Heatmap of the PI3K-AKT pathway-related glycoprotein expression (right panel).

