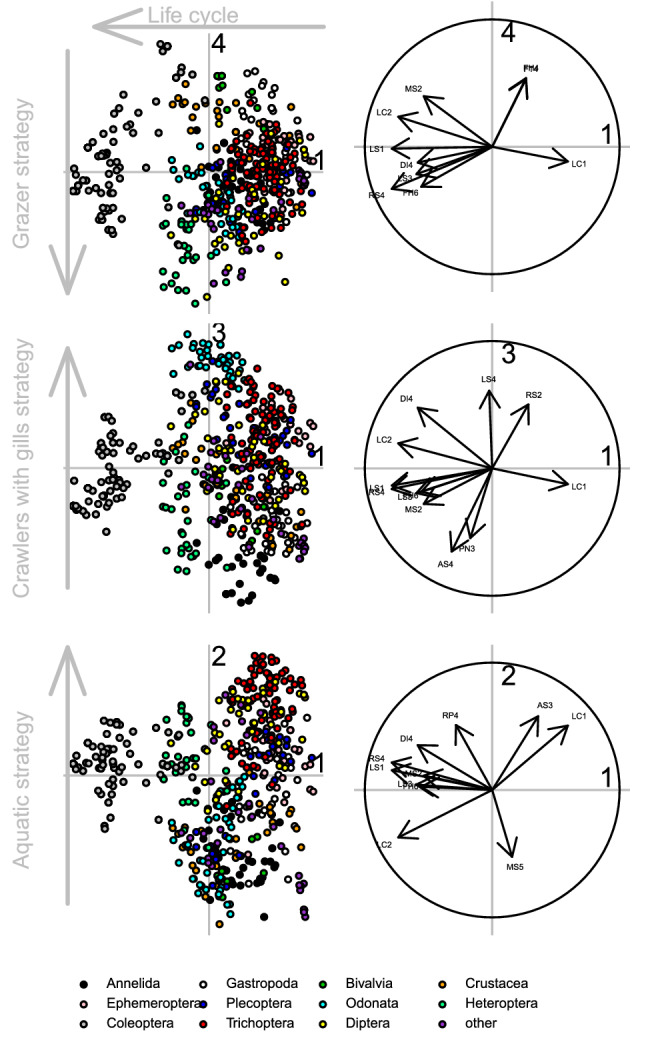
Figure 1.

Centred Principal Component Analysis (PCA) ordination of freshwater macroinvertebrate taxa (left) according to their functional traits (right). The first four PCA axes (indicated by numbers) are depicted in three pairwise combinations (axis 1 versus axis 2, 3 or 4) and only functional traits with correlation r >|0.5| with at least one axis are shown. Grey arrows are used to interpret ecological strategies along the axes. See Table 4, for abbreviations of traits.
