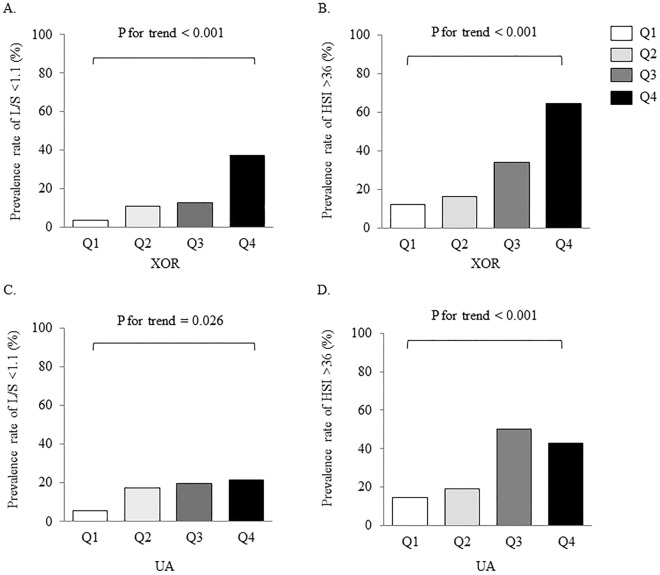
Figure 1.
Comparisons of indices of hepatic steatosis among quadrants of xanthine oxidoreductase (XOR) activity or uric acid (UA) levels. (A) Plasma XOR activity and prevalence rate of liver-to-spleen (L/S) ratio < 1.1, (B) Serum UA levels and prevalence rate of L/S ratio < 1.1, (C) XOR and prevalence rate of hepatic steatosis index (HSI) > 36.0, (D) UA levels and prevalence rate of HSI > 36.0. The proportion of hepatic steatosis between quartiles was examined using the Cochran–Armitage test. Abbreviations: Q, quadrant.

