

Abstract
The local farmers of Central Punjab, Pakistan have been using indigenous grasses as vital components of ruminant diets, but little is reported about their nutritional potential. Hence this study investigated nutritive potential of a selection of ethnobotanically important fodder grasses. Multiple nutritional parameters (proximate components, fibre fractions), secondary metabolites (phenolics, tannins) and in vitro digestibility values were determined. Furthermore, the legitimacy of ethnobotanical knowledge of local inhabitants about these grasses was also verified. The results suggested that majority (77%) of these grasses can be regarded as good quality fodders because of their high protein (169 g/kg) and good digestibility (457 g/kg) with moderate fibre (≤ 602 g/kg), lignin (≤ 50 g/kg) and secondary metabolites (total phenols ≤ 87 g/kg, total tannins ≤ 78 g/kg, condensed tannins ≤ 61 g/kg). Pearson correlation between nutritional parameters indicated that in vitro digestibility values were positively correlated with crude proteins (IVDMD, r = + 0.83 and IVOMD, r = + 0.83 respectively) and negatively correlated with fibre (NDF, r = − 0.91), ADF, r = − 0.84 and ADL, r = − 0.82) contents. Moreover, a positive relationship was identified between ethnobotanical knowledge and laboratory findings for studied grasses. Spearman correlation test showed that ranking of grasses based on ethnobotanical preferences were highly correlated (r values) with the laboratory results for CP (0.85), NDF (− 0.76), ADF (− 0.72) and ADL (− 0.62). The resilient complementarities between ethnobotanical preferences and nutritive analysis authenticate farmer’s traditional knowledge, which needed to be aligned with the corresponding scientific data. Farmers can use these findings for appropriate fodder selection and development of precise supplements for feeding ruminants within a sustainable and economically viable livestock industry for food security.
Subject terms: Plant sciences, Ecology
Introduction
The Punjab province is the most developed, populous, and prosperous region of Pakistan, representing about 60% (110 Million) of the country's total population. It has an area of 205,344 sq km and it is the 2nd largest province in area after Balochistan. This zone is playing a promising role in agricultural production. It contributes about 68% to the annual food grain production, whereas 51 million acres of land is cultivated and another 9.05 million acres are remained to be converted as a cultivable land in different parts of this province (https://punjab.gov.pk/about_punjab_economy). Central Punjab refers to the alluvial planes that are surrounded by the two rivers i.e. Jhelum and Sutlej. This region is one of the biggest and most developed areas of Punjab, comprising one of the most extensive canal irrigation system frameworks in the world. This made it permissible for boosted agricultural output and an immense increment in arable land. Among agribusiness this land not only involves production of staple grains (wheat, maize, rice) but also plays a significant part to supply feeds ingredients for the livestock industry.
This region is one of great providers of ruminant milk and meat in the country. However indigenous farmers or shepherds of rural areas still rely on traditional fodders in order to raise their animals. Diversified range of plants such as trees, shrubs, herbs and grasses are traditionally significant for their fodder value1. Though all kind of floras are in use as fodders, the regional grasses are considered to be a more reliable fodder source for ruminant animals. This preference may be due to the fact that grasses are more palatable than other shrubby fodders for ruminants1–5. As grasses are able to grow massively in various seasons around the year, their accessibility for ruminant feeding is more convenient. It is reported that 53% of total ruminant feed is composed of grasses6. A recent ethnobotanical study of Central Punjab Pakistan had enlisted 53 valuable fodder grasses of this region1. This study also represented an order of priority among ethnobotanically listed fodder grasses which was based on their utilization preferences by local shepherds and animal caretakers.
Though Harun et al.1 highlighted many grasses as potential fodders based on their use by indigenous people to feed animals, this ethnobotanical data requires scientific verification. Thus, nutritional exploration of suitable forage species is strongly recommended for sustainable growth and reproduction of livestock7,8. Such kind of information will be supportive in planning to utilize these conventional fodders more appropriately to eliminate the nutritional inadequacies in animal feeding practices9. Around the globe the nutritional evaluation of ethnobotanical fodder and forages has been in practice10–13. In 2017, six ethnobotanically used grass species of western Maharashtra district Ahmednagar, India were nutritionally evaluated. It was reported that these grasses had relatively good levels of protein which could be a desirable contributor to an animal diet. However sometimes they are rich in silica which can negatively affect feed digestibility14. Another nutritional study conducted in 2004 in North Sumatra, Indonesia revealed that Cynodon plectostachyus was the most nutritious fodder among customarily used grass species15. Similarly in Bangladesh the nutritive value of three fodder grass species (Brachiaria mutica; Echinochloa crusgalli and Hymenachne pseudointerrupta) at different stages of maturity was evaluated. This study declared the studied grasses as a suitable fodder to feed ruminant animals16.
Nutritional evaluation of these ethnobotanically used fodders grasses is a global trend. However, in Pakistan only a few studies had been conducted in this regard and most of these studies were confined to Himalayan grassland17,18, highlands of Baluchistan19 and the desserts of Cholistan20. Moreover, with relevance to Central Punjab, Pakistan we found limited nutritional data about ethnobotanically used fodder grasses. Sultan et al.21 evaluated the nutritional capacitances of ten commonly used irrigated grasses (i.e. Panicum antidotale, Sorghum halepense, Pennisetum purpureum, Vetiveria zizanioides Cymbopogon citrates, Cenchrus ciliaris Leptochloa fusca, Chloris gayana, Cynodon dactylon and Panicum colunum). Ahmed et al.22 also nutritionally investigated two traditionally used fodder grasses (Eragrostis pilosa, Dactyloctenium aegyptium) of district Sargodha. In another study five indigenous grasses (C. ciliaris, L. fusca, C. gayana, C. dactylon and P. colonum) of Faisalabad and Sargodha were subjected to proximate analysis and their order of preference was established on the basis of nutritional facts23. While these studies recommended many grasses as a valuable part of ruminant feed, they did not satisfactorily represent all the nutritional facts of a diversified range of ethnobotanically used fodder grasses in Central Punjab Pakistan.
Therefore, the current research was conducted as an extension of our previous studies1 to generate a nutritional database for the previously identified ethnobotanically used fodder grasses of Central Punjab Pakistan. We anticipate that this information and its subsequent use may help the herdsmen and range managers to determine the incorporation of suitable grasses in animal diets for an improved animal health and performance. Moreover, this study aimed to highlight possible complementarities between the fodder grass rankings based on ethnobotanical knowledge, preferences and nutritional compositions. The outcomes of this study could be used as a benchmark to exploit local fodders more efficiently as a nutritional resource to optimize animal production in an affordable and a sustainable manner.
Results
Nutritional composition
The overall nutritional compositions of studied grasses are presented in Table 1. A wide range of nutritional values were observed among selected grasses under this study. The moisture content of various grass species used for feeding livestock varied between 336 and 798 g/kg. Around 70% of the studied grasses contained more than 600 moisture g/kg. The maximum moisture content was observed in Echinochloa crus-galli, whereas minimum moisture was found in Cenchrus setiger. It is well-known that dry matter (DM) and moisture contents have inverse relationship to each other. Therefore, the grass species with peak moisture content had lowest DM i.e. 202 g/kg and species with minimum moisture possessed the maximum amount of DM i.e., 664 g/kg. Moreover, the ash and organic matter (OM) contents also have reverse relationship among them i.e., minimum ash with greater OM and vice versa. Hence current nutritional results reported the lower ash values in Eragrostis minor (7 g/kg) with upmost OM content (993 g/kg). Whereas Setaria verticillata exhibited the greater ash content (115 g/kg) with lowest OM content (885 g/kg). In regards to the fat content, Acrachne racemosa expressed the maximum value (46 g/kg) while Agrostis gigantean showed the least i.e., 20 g/kg. However, the crude protein (CP) contents in grasses ranged from 41 to 164 g/kg. The lower CP was observed in Arundo donax while higher CP was observed in Eragrostis minor. Interestingly these two species (Arundo donax and Eragrostis minor) exhibited exactly inverse results for NDF. Eragrostis minor reported least NDF (429 g/kg) whereas Arundo donax showed the highest value (798 g/kg). This showed a considerable negative association between CP and NDF contents of grasses. However, in terms of ADF, Zea mays showed the smallest value (247 g/kg) and maximum value was observed in Setaria verticillata (603 g/kg). The utmost ADL content was reported in Arundo donax (153 g/kg) although undermost ADL content was in Brachiaria reptans i.e. 35 g/kg.
Table 1.
Nutritional contents, secondary metabolites and in vitro dry matter digestibility of all the studied ethnobotanical fodder/forage grasses.
| Binomial name | ERG | Nutritional composition (g/kg) | Secondary metabolites (g/kg) | In vitro digestibility (g/kg) | |||||||||||||
|---|---|---|---|---|---|---|---|---|---|---|---|---|---|---|---|---|---|
| M | DM | Ash | OM | Fat | CP | NDF | ADF | ADL | CE | HC | TP | TT | CT | IVDMD | IVOMD | ||
| Agrostis gigantea Roth | A | 624 | 376 | 60 | 940 | 20 | 146 | 562 | 290 | 39 | 251 | 272 | 63 | 66 | 25 | 551 | 524 |
| Avena sativa L | B | 645 | 355 | 78 | 922 | 35 | 123 | 528 | 378 | 53 | 326 | 150 | 51 | 48 | 45 | 461 | 455 |
| Bromus japonicus Thunb | A | 633 | 367 | 68 | 932 | 30 | 140 | 548 | 333 | 33 | 300 | 214 | 45 | 36 | 21 | 529 | 534 |
| Dactylis glomerata L | C | 613 | 387 | 89 | 911 | 36 | 43 | 796 | 603 | 107 | 496 | 193 | 61 | 56 | 42 | 175 | 179 |
| Lolium temulentum Linn | C | 573 | 427 | 91 | 909 | 41 | 53 | 737 | 550 | 78 | 472 | 187 | 135 | 128 | 85 | 313 | 310 |
| Phalaris minor Retz | A | 675 | 325 | 65 | 935 | 35 | 129 | 527 | 364 | 36 | 328 | 162 | 50 | 37 | 31 | 484 | 479 |
| Poa annua L | B | 553 | 447 | 85 | 915 | 34 | 102 | 622 | 324 | 45 | 279 | 298 | 69 | 62 | 50 | 423 | 429 |
| Poa infirma Kunth | B | 693 | 307 | 86 | 914 | 33 | 95 | 638 | 373 | 45 | 328 | 264 | 64 | 53 | 42 | 424 | 429 |
| Polypogon monspeliensis (L.) Desf | B | 536 | 464 | 76 | 924 | 33 | 98 | 604 | 377 | 50 | 327 | 226 | 46 | 40 | 28 | 421 | 424 |
| Arundo donax L | A | 638 | 362 | 64 | 936 | 32 | 41 | 798 | 506 | 103 | 404 | 291 | 62 | 60 | 32 | 208 | 205 |
| Phragmites australis (Cav.) Trin. ex Steud | C | 713 | 287 | 74 | 926 | 42 | 116 | 608 | 448 | 50 | 398 | 160 | 128 | 119 | 52 | 455 | 448 |
| Aristida adscensionis Linn | B | 760 | 240 | 98 | 902 | 35 | 66 | 701 | 506 | 89 | 417 | 196 | 73 | 70 | 42 | 363 | 360 |
| Acrachne racemosa (B. Heyne ex Roth) Ohwi | C | 713 | 287 | 112 | 888 | 46 | 59 | 718 | 508 | 108 | 400 | 210 | 138 | 123 | 58 | 355 | 350 |
| Cynodon dactylon (L.) Pers | A | 601 | 399 | 65 | 935 | 29 | 161 | 444 | 298 | 34 | 264 | 146 | 49 | 38 | 29 | 639 | 645 |
| Dactyloctenium aegyptium (L.) Wild | A | 594 | 406 | 62 | 938 | 33 | 137 | 538 | 340 | 42 | 298 | 198 | 50 | 38 | 26 | 514 | 510 |
| Desmostachya bipinnata (L.) Stapf | A | 645 | 355 | 71 | 929 | 37 | 127 | 589 | 313 | 36 | 277 | 276 | 47 | 39 | 26 | 480 | 471 |
| Eleusine indica (L.) Gaertn | A | 645 | 355 | 63 | 937 | 38 | 159 | 482 | 262 | 37 | 224 | 220 | 40 | 28 | 20 | 623 | 632 |
| Enneapogon persicus Boiss | B | 540 | 460 | 69 | 931 | 34 | 47 | 730 | 554 | 100 | 454 | 177 | 46 | 42 | 36 | 334 | 330 |
| Eragrostis japonica (Thunb.) Trin | B | 579 | 421 | 58 | 942 | 34 | 99 | 652 | 376 | 49 | 327 | 276 | 68 | 55 | 44 | 440 | 441 |
| Eragrostis minor Host | A | 596 | 404 | 7 | 993 | 30 | 164 | 429 | 304 | 39 | 265 | 125 | 49 | 30 | 20 | 659 | 661 |
| Eragrostis pilosa (L.) P. Beauv | B | 619 | 381 | 66 | 934 | 33 | 108 | 511 | 306 | 48 | 257 | 205 | 63 | 59 | 41 | 443 | 448 |
| Leptochloa panicea (Retz.) Ohwi | C | 755 | 245 | 102 | 898 | 42 | 52 | 743 | 518 | 120 | 399 | 225 | 76 | 67 | 53 | 344 | 340 |
| Tetrapogon villosus Desf | C | 689 | 311 | 71 | 929 | 40 | 100 | 633 | 311 | 49 | 263 | 322 | 141 | 132 | 61 | 441 | 448 |
| Apluda mutica L | C | 675 | 325 | 80 | 920 | 41 | 63 | 718 | 522 | 72 | 450 | 196 | 153 | 129 | 71 | 360 | 352 |
| Bothriochloa bladhii (Retz.) S.T. Blake | A | 647 | 353 | 66 | 934 | 30 | 156 | 499 | 319 | 38 | 281 | 180 | 47 | 36 | 30 | 617 | 619 |
| Brachiaria ramosa (L.) Stapf | B | 613 | 387 | 71 | 929 | 31 | 98 | 631 | 488 | 41 | 448 | 143 | 69 | 64 | 46 | 467 | 471 |
|
Brachiaria reptans (L.) C.A.Gardner & C.E.Hubb |
A | 653 | 347 | 58 | 942 | 34 | 142 | 582 | 353 | 45 | 308 | 229 | 44 | 40 | 26 | 544 | 549 |
| Cenchrus biflorus Roxb | B | 677 | 323 | 68 | 932 | 23 | 104 | 606 | 338 | 43 | 294 | 269 | 67 | 59 | 47 | 430 | 435 |
| Cenchrus ciliaris L | A | 524 | 476 | 57 | 943 | 29 | 148 | 552 | 374 | 34 | 339 | 179 | 35 | 21 | 12 | 559 | 556 |
| Cenchrus pennisetiformis Steud | A | 624 | 376 | 58 | 942 | 26 | 137 | 568 | 274 | 42 | 231 | 294 | 38 | 26 | 17 | 519 | 510 |
| Cenchrus setiger Vahl | C | 337 | 663 | 63 | 937 | 44 | 98 | 603 | 423 | 52 | 371 | 180 | 122 | 109 | 72 | 421 | 428 |
| Chrysopogon aucheri (Boiss.) Stapf | A | 590 | 410 | 62 | 938 | 27 | 136 | 552 | 392 | 36 | 356 | 160 | 39 | 28 | 13 | 510 | 507 |
| Chrysopogon zizanioides (L.) Roberty | A | 579 | 421 | 56 | 944 | 22 | 135 | 599 | 326 | 39 | 287 | 273 | 37 | 29 | 19 | 502 | 509 |
| Cymbopogon jwarancusa (Jones.) Schult | C | 723 | 277 | 75 | 925 | 34 | 55 | 749 | 566 | 98 | 468 | 183 | 77 | 66 | 55 | 229 | 225 |
| Dichanthium annulatum (Forssk.) Stapf | A | 664 | 336 | 68 | 932 | 24 | 154 | 512 | 303 | 35 | 269 | 209 | 69 | 56 | 48 | 616 | 610 |
| Digitaria ciliaris (Retz.) Koeler | B | 659 | 341 | 61 | 939 | 33 | 97 | 632 | 393 | 47 | 347 | 238 | 70 | 65 | 58 | 428 | 432 |
| Digitaria longiflora (Retz.) Pers | B | 695 | 305 | 63 | 937 | 33 | 58 | 762 | 601 | 92 | 510 | 161 | 70 | 60 | 50 | 228 | 222 |
| Echinochloa colona (L.) Link | B | 746 | 254 | 60 | 940 | 38 | 103 | 618 | 371 | 41 | 330 | 246 | 78 | 72 | 59 | 426 | 424 |
| Echinochloa crus-galli (L.) P. Beauv | B | 798 | 202 | 60 | 940 | 28 | 106 | 560 | 299 | 48 | 252 | 260 | 63 | 59 | 45 | 435 | 439 |
| Heteropogon contortus (L.) P Beauv. Ex. Roem & Schult | A | 625 | 375 | 66 | 934 | 30 | 53 | 761 | 545 | 98 | 447 | 216 | 49 | 34 | 28 | 241 | 246 |
| Imperata cylindrica (L.) Raeuschel | A | 640 | 360 | 58 | 942 | 30 | 140 | 583 | 279 | 35 | 245 | 304 | 45 | 38 | 23 | 538 | 542 |
| Ochthochloa compressa (Forssk.) Hilu | C | 597 | 404 | 70 | 930 | 41 | 72 | 697 | 521 | 66 | 456 | 176 | 87 | 78 | 61 | 385 | 389 |
| Panicum antidotale Retz | B | 580 | 420 | 67 | 933 | 38 | 15 | 552 | 302 | 49 | 253 | 250 | 67 | 59 | 45 | 616 | 620 |
| Paspalidium distichum L | B | 546 | 454 | 66 | 934 | 36 | 109 | 531 | 313 | 38 | 275 | 218 | 70 | 61 | 49 | 449 | 441 |
| Pennisetum orientale Rich | B | 624 | 376 | 60 | 940 | 34 | 109 | 526 | 291 | 40 | 251 | 235 | 66 | 58 | 51 | 449 | 439 |
| Saccharum bengalense Retz | A | 613 | 387 | 56 | 944 | 30 | 132 | 522 | 310 | 34 | 276 | 213 | 52 | 50 | 37 | 499 | 491 |
| Saccharum spontaneum L | A | 656 | 344 | 53 | 947 | 24 | 126 | 512 | 241 | 40 | 201 | 271 | 62 | 47 | 34 | 471 | 474 |
| Setaria pumila (Poir) Roem. & Schult | A | 663 | 337 | 66 | 934 | 30 | 146 | 567 | 341 | 34 | 307 | 226 | 49 | 42 | 30 | 549 | 538 |
| Setaria verticillata (L.) P. Beauv | C | 661 | 339 | 115 | 885 | 40 | 53 | 744 | 502 | 73 | 429 | 242 | 139 | 132 | 65 | 226 | 223 |
| Setaria viridis (L.) P. Beauv | A | 515 | 485 | 59 | 941 | 36 | 149 | 532 | 245 | 40 | 205 | 287 | 41 | 29 | 12 | 610 | 602 |
| Sorghum bicolor (L.) Moench | A | 599 | 401 | 62 | 938 | 27 | 140 | 566 | 349 | 44 | 305 | 218 | 60 | 50 | 32 | 539 | 531 |
| Sorghum halepense (L.) Pers | A | 697 | 303 | 66 | 934 | 29 | 160 | 462 | 218 | 38 | 180 | 245 | 59 | 47 | 34 | 630 | 622 |
| Zea mays L | A | 634 | 366 | 63 | 937 | 29 | 164 | 452 | 229 | 34 | 195 | 223 | 68 | 70 | 33 | 641 | 635 |
| mean | 632 | 368 | 69 | 931 | 33 | 108 | 602 | 381 | 54 | 327 | 221 | 68 | 59 | 40 | 457 | 463 | |
Moisture (M), dry matter (DM), organic matter (OM), crude proteins (CP), neutral detergent fibre (NDF), acid detergent fibre (ADF), acid lignin fibre (ADL), cellulose (CE), hemicellulose (HC), total phenolics (TP), total tannins (TT), condensed tannins (CT), In vitro Dry matter digestibility (IVDMD), In vitro organic matter digestibility (IVDMD), Ethnobotanical ranking groups (ERG) determined in the previous study of Harun et al.1, where A, B and C were identified as respectively high, moderate and low priority ethnobotanical grasses based on the experiences of local farmers.
Secondary metabolites
In this current research, the anti-nutrient contents presented considerable variations in total phenols (TP), total tannins (TT) and condensed tannins (CT) i.e. 35–153 g/kg, 21–132 g/kg and 12–85 g/kg, respectively (Table 1). Among all the tested grass species, the maximum secondary metabolites were reported in Cenchrus setiger, Phragmites australis, Acrachne racemosa, Lolium temulentum, Apluda mutica, Tetrapogon villosus and Setaria verticillata. Conversely, the lowest values were recorded in Cenchrus ciliaris followed by Cenchrus pennisetiformis, Chrysopogon aucheri, Eleusine indica Chrysopogon zizanioides, Setaria viridis and Eragrostis minor.
In vitro digestibility
Current digestibility analysis reported mean values of 457 g/kg and 463 g/kg for in vitro dry matter digestibility (IVDMD) and in vitro organic matter digestibility (IVOMD) respectively. The highest IVDMD and IVOMD were observed in Eragrostis minor (660 and 661 g/kg respectively) whereas the minimum values were observed in Dactylis glomerata (175 and 179 g/kg respectively) (Table 1).
Discussions
As indicated in Table 1, the average moisture and DM contents were within the range for good quality fodders. However, it also depended upon the time, stage and weather of harvesting. The reported DM contents of Cenchrus ciliaris, Cynodon dactylon, Apluda mutica, Setaria pumila, Saccharum spontaneum, Desmostachya bipinnata and Pennisetum orientale were found to be much higher in comparison to the values presented by Sultan et al.24 who analyzed some grasses from Northern regions of Pakistan. The probable reasons for this variation are disparities in the land geography, climate, soil composition and sampling times which can affect the corresponding nutritional variations in forages25–28. However, in comparison to the current study, Manzoor et al.23 and Sultan et al.21 reported lower DM values for some grasses (Cenchrus ciliaris, Cynodon dactylon, Panicum antidotale, Sorghum helepense and Chrysopogon zizanioides) from the same geographical range. These lower values were possibly due to differences in soil fertility level, phenological states of grasses, and sampling or analytical procedures.
It is worthwhile to know the amount of total ash in different feeds because it contains different types and amounts of macro, micro and trace minerals which are needed for ruminant animal’s health29. This information can help us to use suitable forages for feeding animals to satisfy their mineral requirements with or without supplements. Conversely, high mineral contents in animal feeds may dilute the quantity of other available nutrients to animals. Moreover, if animal fed with excessively high mineral contents, these will not only affect the digestibility but also might cause the accumulation and crystallization which ultimately lead to urinary restrictions or infections. In the current study mean ash and OM contents were found to be within the satisfactory limits (Table 1). Sultan et al.24 and Rafay et al.20 stated much higher ash values for Cenchrus ciliaris, Cynodon dactylon, Setaria pumila, Saccharum spontaneum, Pennisetum orientale Cymbopogon jwarancusa, Ottochloa compressa and Panicum antidotale. Variation in soil and other habitat features might have affected the ash content of plants30. However, the current ash values were also found to be lower than the reported values from similar agro climatic zone21,23. These lower ash values inferred the probable less soil contamination of these samples31.
The current study reported that the average fat content was 33 g/kg which is within acceptable limits for ruminant diets (Table 1). This amount reasonably satisfies the ruminant’s fat requirement. In fact, high concentrations of dietary fats can not only suppress the rumen microbial (protozoa and fungi) activity but also it can reduce the fibre digestion and DM intake in ruminant animals32.
This study found that out of 53 studied fodder grass, 40 species possessed fairly moderate to good CP range i.e. 169–95 g/kg. Generally, the upper limit of CP values in present analysis were found to be relatively higher than the maximum CP content of some previously studied grass species from similar zone21,23. These disparities in CP content were probably due the difference in their growth stages and soil fertility at the time of sampling23,33. However comparable CP values were reported by other researchers31,34–36, who obtained variable CP contents (up to 170 g/kg) of several tropical grasses around the globe. The ruminant’s protein demand varies according to its age or growth stage, such as the higher CP levels (150–160 g/kg) are especially good for lactating cows because during lactation amino acids demand is higher for additional metabolic functions and synthesis of milk protein37. Current results revealed that Dichanthium annulatum, Bothriochloa bladhii, Eleusine indica, Sorghum helepense, Cynodon dactylon, Zea mays and Eragrostis minor were especially good in this aspect because of their higher CP content. However, for non-lactating ruminants comparatively lower protein intake is recommended. Therefore, measurement of CP is a supportive tool in order to assure that animal is ingesting sufficient proteins as per its body requirement. As intake of excessive proteins or consumption of poor quality proteins are both economically detrimental29.
The recommended critical value for CP content is 70 g/kg38. Results showed that CP of Ottochloa compressa (72 g/kg) was at borderline; whereas remaining 12 grasses possessed CP lower than the critical value (Fig. 2). They showed decreasing CP contents from 60 to 40 g/kg and their descending order was arranged as Aristida adscensionis > Apluda mutica > Acrachne racemosa > Digitaria longiflora > Cymbopogon jwarancusa > Lolium temulentum > Setaria verticillata > Heteropogon contortus > Leptochloa panacea > Enneapogon persicus > Dactylis glomerata > Arundo donax. By comparing these results with ethnobotanical priority groups of fodder grasses (previously reported by Harun et al.1 it was shown that two (A. donax and H. contortus) of those grasses belonged to the high priority group (A) and three (A. adscensionis, E. persicus, D. longiflora) were from moderate priority group (B) whereas rest of the seven grasses were from the low priority grass group (C). The presence of greater number of fodder grasses with lower CP in group C declares a supportive evidence for ethnobotanical knowledge of local inhabitants of the study area. The intake of this kind of protein deficient diet will not only result in the loss of appetite but also reduce the cellulolytic activity of rumen microbes which slow down the fibre digestion39. Low feed intake and poor digestion reduce the food efficiency which can cause underprivileged growth and development of livestock40,41. Therefore, for healthy animal productivity uninterrupted supply of CP is mandatory42,43. Although 77% of studied grasses showed sufficient levels of CP which recommend them as good protein sources for maintaining healthy livestock, they still cannot compete with high CP containing legumes44,45. The differences between grass and legumes for CP contents are quite significant; hence a blend of grass and legume in ruminant diet is more recommendable34,46.
Figure 2.

Clustering of ethnobotanical fodder grasses based on their secondary metabolite contents i.e. high (> 100 g/kg), moderate (50–100 g/kg) and low (< 50 g/kg). Here, greater number of species were in low (24) followed by moderate (22) and high (7) grass clusters.
Fibre is often regarded as the negative index of nutritive quality47,48. It is negatively related to digestibility of feed, as lower the concentration of fibre in feed it become easier to digest which results in good energy value24. Fibre can be determined in terms of NDF and ADF contents but the NDF method is considered to be most reliable one for measuring the total cell wall a fibre contents in a feed29. Forage digestibility and ruminant’s consumption capacity largely influenced by its NDF content49. Its value in animal feed is quite critical and a feed is considered to be of poor quality if it has NDF above 650 g/kg50. The current study revealed the mean NDF value of 602 g/kg which is under the critical limit but 12 species i.e., Arundo donax > Dactylis glomerata > Digitaria longiflora > Heteropogon contortus > Cymbopogon jwarancusa > Setaria verticillata > Leptochloa panacea > Lolium temulentum > Enneapogon persicus > Apluda mutica > Acrachne racemosa > Apluda mutica > Aristida adscensionis had NDF above the critical value (650 g/kg). However, Ottochloa compressa exhibited the NDF values that were very close to the critical value of 697 g/kg. The grasses with more than the critical NDF value indicated reduction in voluntary feed intake and feed conversion efficiency but lengthier rumination periods51. Norton37 stated that NDF varying from 670 g/kg to 780/kg was considered to be high enough to limit DM intake and digestibility. The results predicted an interesting relationship between CP and fibre contents as indicated in Fig. 1. This figure showed grasses with higher CP were lower in NDF.
Figure 1.

Comparative illustration of the CP and NDF contents of ethnobotanical grasses (Yellow NDF bars showing above critical value > 650 g/kg while red CP bars showing below critical value < 70 g/kg).
NDF is also associated with other cell wall structural contents i.e., lignin, cellulose and hemicellulose52. Lignin content is also negatively correlated with fodder palatability42,53 because it has negative affect on OM digestibility54. The average ADL content was reported as 382 g/kg. One of the significant reasons in preference of grasses by ruminants is their digestible cellulose and hemicellulose contents. The microflora of ruminant’s digestive is capable to efficiently digest cellulose and hemicellulose of grasses42. The mean cellulose and hemicellulose in studied grasses were reported as 317 g/kg and 220 g/kg, respectively. However, digestibility of cellulose is inversely proportional to the amount of lignin. As fodder matures its lignification increases with 100 g/kg which lessens the cellulose digestibility by about 60%. The lignin content in younger fodder is the 50 g/kg, which increases the cellulosic digestibility up to 80%55. The current results exhibited that 75% of species had lignin from 34 to 50 g/kg which represented their good cellulosic digestibility. However a few species with higher lignin content (Brachiaria ramosa, Phragmites australis, Ottochloa compressa, Apluda mutica, Dactylis glomerata, Lolium temulentum, Leptochloa panicea, Digitaria longiflora, Heteropogon contortus, Cymbopogon jwarancusa, Enneapogon persicus, Arundo donax, Setaria verticillata. Acrachne racemosa, Aristida adscensionis) negatively affected the cellulose digestion in ruminants. On comparison with previous studies relatively higher fibre values (NDF, ADF, ADL, cellulose and hemicellulose) were found in the findings stated by Rafay et al.20 and Sultan et al.24. The soil fertility and season of fodder harvesting are important influencing factors for variation in fibre contents56–58.
Secondary metabolites like phenolics and tannins are known as anti-nutritional factors because of their negative effects on ruminant health especially if consumed in large amounts59–62. The significant possible damages of secondary metabolites are such as reduction in immune function, growth and reproduction impairments, which ultimately leads to animal morbidity and mortality63,64. By considering these effects, quantification of secondary metabolites is appraised to be essential in order to make appropriate fodder selection65. According to reports, tannins at 60–120 g/kg DM in animal diet can lower the efficiency of animal digestive system and ultimately its productivity as well60. However, few other researchers reported that low levels of these secondary metabolites positively affected ruminant health66,67. Like condensed tannins between 20 and 50 g/kg DM are essentially required for efficient utilization of nitrogen and healthy weight maintenance66. On the basis of recommended acceptable ranges of secondary metabolites, the studied grass species had been categorized into three groups i.e. high (> 100 g/kg), moderate (50–100 g/kg) and low (< 50 g/kg). Figure 2 shows that greater number of species were in low (24) followed by moderate group (22) and high (7). Grass species ranked as low and moderate groups are within the satisfactory limits for animal health. These results suggested that 86% of studied grass species possessed fewer secondary metabolites than their suggested toxic levels which indicated that those were potentially of good quality as animal fodders. Certain levels of phenols in these species are beneficial as antioxidative, anti-inflammatory, anti-diabetic, anti-allergy, anti-microbial and gastro or hepato-protective activities68. Moreover, sufficient tannin concentrations facilitate to increase the digestion proficiency, milk production, wool growth and animal’s ovulation rate69. Additionally, specific quantity of these secondary metabolites has positive ecological effects such as improvement of soil quality and nutrient cycles69. However, grasses belong to the high secondary metabolite category (Cenchrus setiger, Phragmites australis Acrachne racemosa, Lolium temulentum, Apluda mutica, Tetrapogon villosus and Setaria verticillata) are not considered good for ruminant’s health. Panhwar64 stated that the excessive intake of secondary metabolites (anti nutrients) could affect the digestibility of vital nutrients which not only lessened the palatability but could also be fatal. It had been reported that higher dosage of phenols may reduce the bone mineralization and could also cause disturbance in cholesterol or estrogen levels70–72. Whereas greater amounts of tannins could result in reduction of protein digestion and absorption which eventually depress the voluntary feed intake (VFI)73,74.
As reported above, numerous nutritional parameters can indicate the potential feed values for providing particular nutrients. However, the real feed value for animal can only be determined by finding the digestion of those nutrients. However, the digestibility of fodder or forages were strongly affected by the seasonal variations75. Kallah et al.76 and Megersa et al.77 suggested that on average 450 g/kg digestibility of forage/fodder was sufficient to maintain an optimal animal performance. The findings of Van Soest78 suggested that 400–700 g/kg digestibility for grasses were found in tropical and subtropical lands. Noguiera39 also acclaimed 400–527 g/kg digestibility for grasses. For more understanding, ethnobotanical grasses were further classified into 3 clusters i.e. high (< 450 g/kg), medium (400–450 g/kg) and low digestible grasses (> 400 g/kg) (Fig. 3). Results reported greater number of grass species (n = 29) in high digestible cluster followed by low (n = 13) and medium (n = 11) digestibility groups. Minor in vitro DM digestibility indicates the presence of anti-nutritional factors within those fodders which can obstruct the activity of microbial activities in rumen24,79,80.
Figure 3.

Clustering of ethnobotanical fodder/grasses based on their in vitro digestibility i.e. high (< 450 g/kg), medium (400–450 g/kg) and low digestible fodder grasses (> 400 g/kg). Results showing greater number of grass species (n = 29) in high digestible cluster followed by low (n = 13) and medium (n = 11) digestibility clusters.
Correlation between studied nutritional parameters
Evitayani et al.15 also predicted similar negative relationship between CP and fibre contents while studying nutritive value of tropical forages in North Sumatra, Indonesia. This clearly indicates that if any species possessed high protein content then its NDF, ADF, ADL and cellulosic contents must be lower. Especially the negative connection between CP and NDF contents was also supported by Ronquillo et al.81 and Mlay et al.82. Whereas with the exception of hemicellulose, all other studied fibre contents (NDF, ADF, ADL and cellulose) exhibited significant positive relationship with each other.
Many factors influenced the digestibility of a particular fodder. Harper and McNeill49 described that forage digestibility was negatively influenced by NDF contents whereas Arif et al.83 argued about the positive influence of CP on digestibility values of fodder/forages. As mentioned in Table 2, IVDMD and IVOMD values were positively correlated with CP (r = + 0.83 and r = + 0.83 respectively) and negatively correlated with NDF (r = − 0.91), ADF (r = − 0.84) and ADL (r = − 0.82 in studied fodders grasses. These results can be interpreted as that by increasing the crude protein the digestibility amplified, however increase in cell wall content lessened the digestibility of a particular fodder. These correlation findings were in line with the previous findings21,24,84,85. These results were also concordant with the report of Van Soest47 who stated negative association between NDF and digestibility of various feeds. Lichtenberg and Hemken86 specified that DM digestibility was decreased by 3–4 units with per unit increase in lignin content. However, poor digestibility fodder grasses can be improved by adding urea supplements into an animal diet65. Some other studies also supported the fact that by addition of urea as a supplement can improve the digestibility of low quality forages87,88.
Table 2.
Pearson correlations (r) (alongside their significance levels at *, **, ***) between crude proteins (CP) and overall fibre content neutral detergent fibre (NDF), acid detergent fibre (ADF), acid lignin fibre (ADL), cellulose (CEL), hemicellulose (HCL), total phenol (TP) total tannins (TT), condensed tannins (CT), in vitro dry matter digestibility (IVDMD), in vitro organic matter digestibility (IVOMD) (g/kg) of studied ethnobotanical fodder/forage grasses (n = 53).
| Items | CP | NDF | ADF | ADL | CE | HC | TP | TT | CT | IVDMD | IVOMD |
|---|---|---|---|---|---|---|---|---|---|---|---|
| CP | − 0.856*** | − 0.786*** | − 0.819*** | − 0.735*** | 0.009 | − 0.477*** | − 0.495*** | − 0.607*** | 0.832*** | 0.827*** | |
| NDF | 0.893*** | 0.859*** | 0.855*** | 0.045 | 0.442** | 0.458** | 0.488*** | − 0.914*** | − 0.914*** | ||
| ADF | 0.849*** | 0.989*** | − 0.409** | 0.419** | 0.418** | 0.489*** | − 0.844*** | − 0.844*** | |||
| ADL | 0.761*** | − 0.144 | 0.361** | 0.368** | 0.405** | − 0.818*** | − 0.820*** | ||||
| CE | − 0.461** | 0.413** | 0.410** | 0.486*** | − 0.806*** | − 0.805*** | |||||
| HC | − 0.035 | − 0.001 | − 0.096 | 0.020 | 0.021 | ||||||
| TP | 0.987*** | 0.845*** | − 0.422** | − 0.424** | |||||||
| TT | 0.857*** | − 0.442** | − 0.447** | ||||||||
| CT | − 0.528*** | − 0.526*** | |||||||||
| IVDMD | 0.999*** |
Here *, ** and *** represent significance at P < 0.05, P < 0.01 and P < 0.001 respectively.
Moreover, it also had been observed that digestibility was inversely proportional to secondary metabolite contents (anti-nutritional factors). As shown in Table 2. The IVDMD and IVOMD values showed negative association with TP (r = − 0.422 and − 0.424 respectively), TT (r = − 0.442 and − 0.447 respectively) and CT (r = − 0.528 and − 0.526 respectively). Njidda89 supported this fact that low level of tannins resulted in good IVDMD of fodders. This is because those tannins in NDF and ADF firmly bound to cell wall and cell protein and thus resulted in lower digestibility values51. Whereas CT had also been notorious in order to lower the digestibility values54.
Correlation between ethnobotanical knowledge and laboratory findings
After obtaining the nutritional results, all the studied grasses were ranked in order of priority with reference to CP, NDF, ADF, ADL, IVDMD and IVOMD contents. These nutritional rankings were compared with the ethnobotanical preferences ranking of fodder/forage grasses established earlier in the previous study of Harun et al.1 (Figs. 4, 5, 6, 7, 8). The results demonstrated strong correlations between laboratory findings and ethnobotanical knowledge about studied forages/fodder grasses, perceived by local respondents. Figure 4 showed a strong positive association (r = + 0.8) between ranking based on CP and ethnobotanical preferences. This means that grasses which ranked as a high priority by local communities also possessed sufficient quantities of proteins and fodder grasses with low priority were below the critical CP value (> 70 g/kg). However, as CP and fibre contents were inversely proportional to each other, ranking order based on NDF, ADF and ADL exhibited negative correlation (r = − 0.768, r = − 0.726, r = − 0.625 respectively) with the ethnobotanical preferences of fodder grasses (Figs. 5, 6, 7). This can be inferred that a fodder/forage grass with high fibre content is least preferable by the local farming communities of Central Punjab Pakistan. Also, the ranking based on the digestibility results of fodder grasses positively correlated (r = + 0.876) with the ethnobotanical rankings of these grasses (based on the experiences of local people) (Fig. 8).
Figure 4.
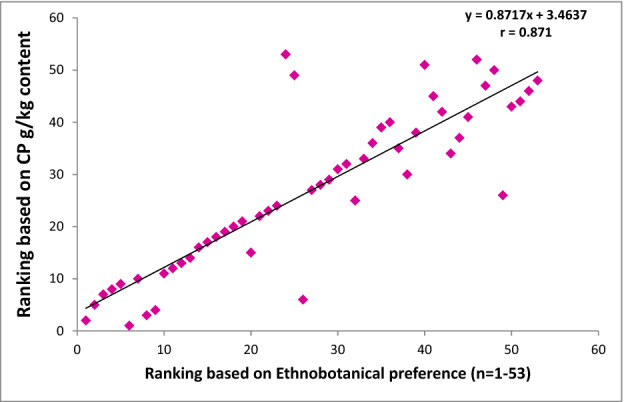
Positive correlation (r) between ethnobotanical preferences ranking of fodder grass versus order of priority based on CP content (high to low).
Figure 5.
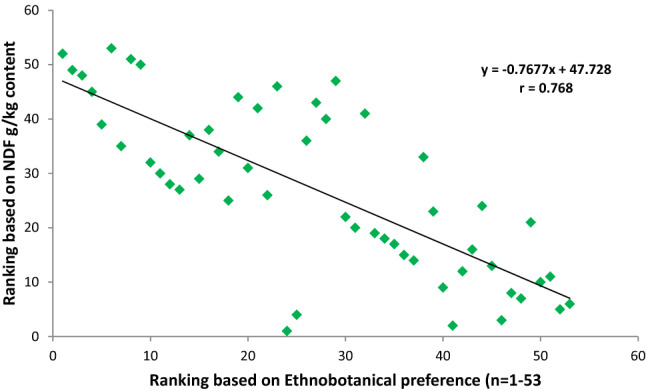
Negative correlation between fodder grass rankings based on ethnobotanical preference ranking versus ranks based on NDF contents (high to low).
Figure 6.
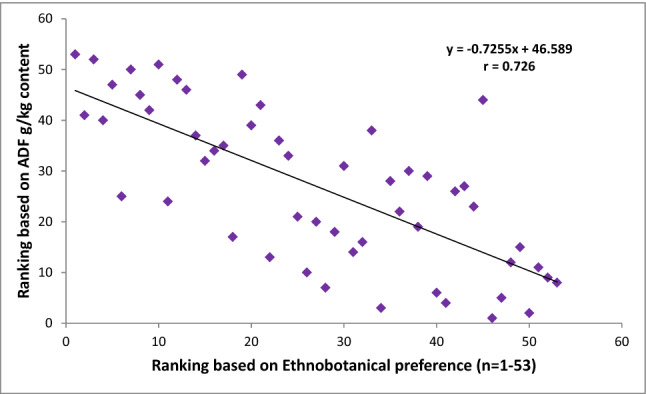
Negative correlation between fodder grass rankings based on ethnobotanical preference ranking versus ranks based on ADF contents (high to low).
Figure 7.
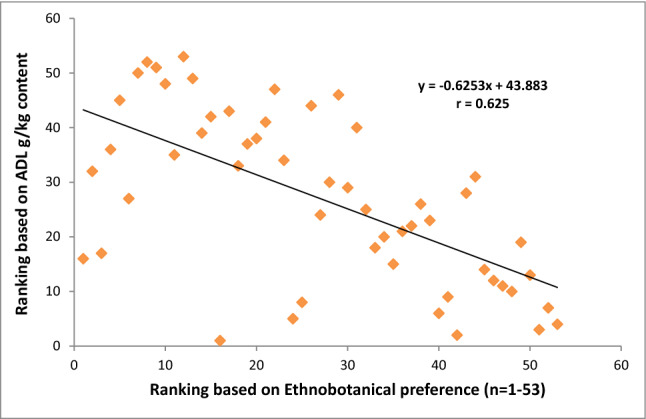
Negative correlation between fodder grass rankings based on ethnobotanical preference versus ranks based on ADL contents (high to low).
Figure 8.

Positive correlation between fodder grass rankings based on ethnobotanical preference versus order of priority based on in vitro digestibility (high to low).
Results of crosstab analysis reported strikingly positive associations between the clusters of grasses based on laboratory results (in vitro digestibility and secondary metabolites) and ethnobotanical ranking groups of high, medium and low priority. Secondary metabolites analysis also showed an affirmative association with ethnobotanical knowledge. Crosstab analyses clearly declared that grasses ranked in high and medium ethnobotanical priority groups were comparable to low and medium secondary metabolites ranking groups (Table 3). Additionally, those grasses which were least preferred ethnobotanically lie in the category of high secondary metabolites (anti-nutrients) group. This can be explained as the grasses of high and medium ethnobotanical fodder priority possessed secondary metabolites (total phenols, total tannins and condensed tannins) below the critical limit whereas grasses with least ethnobotanical fodder priority contained comparatively higher amount of secondary metabolites. Moreover, Crosstab analysis of in vitro digestibility and ethnobotanical ranking groups of grasses showed that out of 25 high priority ethnobotanical grasses, 23 grasses were also positioned in high priority group based on the in vitro digestibility values. Similarly, out of 11 low priority ethnobotanical grasses group, 8 grasses were also placed in low priority group of in vitro digestibility (Table 4). The study revealed that the ethnobotanical knowledge of local shepherds and animal caretakers was quite consistent with the nutritional data of studied grasses. The current findings are in agreement with the reported data of Keba et al.10, Dhungana et al.11, Talore12, Rakib-Uz-Zaman et al.90 and Rodrigues et al.91 who supported the positive association between laboratory results and ethnobotanical knowledge. Therefore, traditional knowledge should not be ignored and must be used as an approach for better understanding of nutritive potential of local fodder/forage resources under predominant environmental conditions. However, the laboratory based nutrient compositions are needed to formulate nutritious diets to optimize the use of local feed resources to promote livestock health and the environment.
Table 3.
Crosstab analyses between secondary metabolites based grass categories and ethnobotanical ranking groups of studied ethnobotanical fodder grasses.
| Ethnobotanical ranking groups | Secondary metabolites based grasses categories | Total | ||
|---|---|---|---|---|
| High | Medium | Low | ||
| High (A) | 0 | 4 | 21 | 25 |
| Medium (B) | 0 | 14 | 3 | 17 |
| Low (C) | 7 | 4 | 0 | 11 |
| Total | 7 | 22 | 24 | 53 |
Table 4.
Crosstab analyses between In vitro digestibility’s based grasses categories and ethnobotanical ranking groups of studied ethnobotanical fodder grasses.
| Ethnobotanical ranking groups | In vitro digestibility based grasses categories | Total | ||
|---|---|---|---|---|
| High | Medium | Low | ||
| High (A) | 23 | 0 | 2 | 25 |
| Medium (B) | 5 | 9 | 3 | 17 |
| Low (C) | 1 | 2 | 8 | 11 |
| Total | 29 | 11 | 13 | 53 |
Conclusions
Grasses of Central Punjab Pakistan had been used as animal fodder for centuries but unfortunately little information about their nutritional worth was available. This study not only provided a nutritional profile of studied grasses but also made an attempt to validate the ethnobotanical knowledge of local inhabitants of Central Punjab Pakistan about these fodder grasses. It can be concluded that a strong positive correlation existed between ethnobotanical preferences of fodder grasses and nutritional facts of particular species. Nutritional results confirmed that those grasses which ranked superior by the local inhabitants of the study area also contained higher CP levels than those species which were ranked as inferior. Moreover, the grasses perceived for low palatability possessed great levels of structural fibres (NDF, ADF and ADL) and secondary metabolites (anti-nutrients). The Pearson correlation studies also showed that grasses with higher proteins had low fibre content and good digestibility. It can be summarized that good quality fodders were high in protein and digestible nutrients, but low in fibre and lignin. The strong complementarities between ethnobotanical preferences and nutritive analysis reflected the reliability of ethnobotanical knowledge of local farmers and shepherds. However, it is recommended to integrate these conventionally used fodders into modern feeding systems. The good quality grasses can be directly incorporated into ruminant diets whereas grasses with low nutritional quality can be improved by using biochemical processing before making either silage or hay or can be mixed with either good quality forages or supplements before feeding the animals. These results are valuable in making appropriate fodder selection and supplement development that will match livestock requirements which consequently can support economical livestock performance. However, further studies are required to evaluate their mineral composition; feed intake and animal’s ability to efficiently utilize these ethnobotanical feed resources for sustainable animal production in low to moderate animal input systems.
Methods
Study area and its main features
The study was conducted in Central Punjab region of Pakistan which is regarded as the subtropical continental low land (Fig. 9). Normally temperature of this region remains hot but also shows significant variation between summers and winters. On average, the summer temperature ranged between − 2° and 45 °C whereas in winters it can drop down to − 10 °C. The mean annual rainfall of this area is 46 cm. This region consists of 19 cities which are categorized under 3 agro-ecological zones i.e., Northern irrigated zone, Sandy deserts zone and Barani zone. For the current study Northern irrigated zone was selected because the dominant grasses in this zone were a result of irrigation by using an extensive canal system and a good precipitation. Most of the time ad libitum grazing was in practice but cut and carry system for mixing specific forages with other feed types was also used in these regions1.
Figure 9.

Illustration of sample collection sites i.e. Sargodha, Sialkot, Lahore, Gujranwala, Faisalabad, Okara, Sahiwal, Jhang, Sheikhupura, Nankanasab rcGIS version 10.8 software was to draw this map. Basemap is added by choosing the online basemap option in ArcGIS. https://www.esri.com/en-us/arcgis/products/arcgis-pro/overview.
Sampling of fodder grasses
For sample collection the rural areas from Northern irrigated zone were actually targeted because of their reliance around feeding conventional grasses for raising their ruminant animals. As the literature reported, the grasses were more palatable before their maturity. Therefore, representative samples of each of the 53 specimens from different parts of the same field were collected at their pre bloom stage through repeated field visits during this study. These samples represented the same fodder grasses as previously reported by Harun et al.1. Representatives of collected fodder grass sample was taxonomically identified by using specimen identification guidelines in the herbarium of Lahore College for Women University, Lahore and the Quaid i Azam University, Islamabad. Moreover two online plant databases i.e. flora of Pakistan (http://www.efloras.org/index.aspx) and flora of India (https://sites.google.com/website/efloraofindia/) and various grass flora identification keys92 were also used in fodder grass identification process. However, remaining samples were washed to remove contaminants or dust particles, shade dried and finely ground (Ultracentrifugal mill ZM 200). All the samples were kept inside airtight polythene bags until further nutritional analysis as described below.
Nutritional analysis
Parameters like moisture, dry matter, ash, proteins, fat, were evaluated by following the standard methods of AOAC93. Nitrogen content was determined by the advance MACRO CUBE System and obtained nitrogen value was multiplied by 6.25 to estimate the crude protein (CP) contents of these samples. However, for fat analysis advance micro-digester (MARS6) was used. Whereas neutral detergent fibre (NDF), acid detergent fibre (ADF), acid lignin fibre (ADL) were done by adopting the methodology prescribed by Van Soest et al.48. Cellulose and hemicellulose contents were calculated by the formulae Cellulose = ADF-ADL, Hemicellulose = NDF-ADF48.
Secondary metabolites analysis
The selected secondary metabolites i.e. total phenols (TP), total tannins (TT) and condensed tannins (CT) that can affect the fodder quality were also estimated by using the methodology prescribed by Makkar et al.94. For the estimation of TP, TT and CT tannic acid and epigallocatechin gallate was used respectively to establish relevant standard curves.
In vitro digestibility analysis
The method of Tilley and Terry95 was adopted for digestibility test by using only the first stage of the 2 stage procedure. Rumen fluid (RF) was collected from 3 freshly slaughtered cattle (Aberdeen Angus breed) at a local abattoir (Linden Foods, Ltd.) of Newcastle upon Tyne, UK. Equal volumes of these RF were pooled and then mixed with the pre warmed buffer solution in a ratio of 1:2 and kept at 39 °C in a water bath (Gallenkamp UK Ltd) in order to maintain anaerobic conditions. Moreover, carbon dioxide was flushed into this buffered RF (BRF) and pH was adjusted around 7. For the incubation 0.5 g of each ground fodder grass sample was put inside the 50 ml capacity polypropylene tubes and 40 ml of the BRF was also dispensed into each tube. These tubes were sealed with the rubber stoppers (equipped with gas pressure discharge valves) and incubated in a water bath at 39 °C. The tubes were shaken manually few seconds thrice a day (morning, afternoon, evening). After 48 h the tubes were taken out and placed inside an ice filled bucket to stop the on-going fermentation. Later on the tubes were subjected to centrifugation (accuSpinTM3R) at 2000 rpm for 10 min. The insoluble residues were washed, dried, weighed and then ashed before estimating In vitro dry matter digestibility (IVDMD) and In vitro organic matter digestibility (IVOMD). IVDMD of samples were measured by drying the washed residues at 80 °C whereas IVOMD was estimated by formation of ash in the furnace at 550 °C. The calculations were done by following the formulae mentioned below and a blank sample of BRF was used for correction in dry matter residue weight.
Ranking of studied fodder grasses
After obtaining laboratory results (nutritional, secondary metabolites and digestibility) the fodder grasses (n = 53) were ranked in descending order (high to low) according to results of each studied parameter. For each parameter, grass at rank 1 considered as most potential one whereas at rank 53 with the lowest potential. This ranking helped to correlate the laboratory findings with ethnobotanical preferences.
Statistical analysis
The obtained data was computed in the excel sheets and graphical illustrations were made for data analysis. Correlation between CP, NDF, ADF, ADL, CE and HC were inferred by using Pearson correlation method (r < 1; P < 0.05) through SPSS version 23. Moreover, the Spearman’s rank correlation (r < 1; P < 0.05) was also used to examine possible relationships between laboratory results and ethnobotanical preferences of fodder and grazing grasses at P < 0.01. Crosstab method within descriptive statistics of SPSS was also employed for making comparisons between secondary metabolites based grass categories and ethnobotanical ranking of studied fodder grasses. Additionally, comparisons were made between In vitro digestibility based grass categories and ethnobotanical ranking of studied fodder grasses. Microsoft Excel was used to organize different data sets for creating trend lines and visual presentations.
Acknowledgements
We acknowledge Dr. Muhammad Zafar, Department of Plant Sciences, Quaid i Azam University Islamabad for authorizing us to use their herbarium. Nidaa Harun also thanks Higher Education Commission of Pakistan for travel funding to cover the part costs of processing the data at Newcastle University, UK.
Author contributions
Research was designed by S.S. and M.A. Laboratory analysis was performed by N.H. A.S.C. supervised this study in Newcastle University, UK and also supported the data analysis and manuscript writing. H.B., N.H. A.S.C. and Z.S. contributed in structuring and improving the scientific language of this article.
Data availability
The datasets used and/or analyzed during the current study are available from the corresponding author on a reasonable request.
Competing interests
The authors declare no competing interests.
Footnotes
Publisher's note
Springer Nature remains neutral with regard to jurisdictional claims in published maps and institutional affiliations.
These authors contributed equally: Nidaa Harun and Abdul Shakoor Chaudhry.
References
- 1.Harun N, Chaudhry AS, Shaheen S, Ullah K, Khan F. Ethnobotanical studies of fodder grass resources for ruminant animals, based on the traditional knowledge of indigenous communities in Central Punjab Pakistan. J. Ethnobiol. Ethnomed. 2017;13(1):56. doi: 10.1186/s13002-017-0184-5. [DOI] [PMC free article] [PubMed] [Google Scholar]
- 2.Shaheen H, Qureshi R, Qaseem MF, Bruschi P. The fodder grass resources for ruminants: A indigenous treasure of local communities of Thal desert Punjab, Pakistan. PLoS One. 2020;15(3):e0224061. doi: 10.1371/journal.pone.0224061. [DOI] [PMC free article] [PubMed] [Google Scholar]
- 3.Huston JE. Forage utilization and nutrient requirements of the goat1. J. Dairy Sci. 1978;61(7):988–993. doi: 10.3168/jds.S0022-0302(78)83679-0. [DOI] [Google Scholar]
- 4.Wilson AD, Leigh JH, Hindley NL, Mulham WE. Comparison of the diets of goats and sheep on a Casuarina cristata–Heterodendrum oleifolium woodland community in western New South Wales. Aust. J. Exp. Agric. 1975;15(72):45–53. doi: 10.1071/EA9750045. [DOI] [Google Scholar]
- 5.Grünwaldt EG, Pedrani AR, Vich AI. Goat grazing in the arid piedmont of Argentina. Small Ruminants Res. 1994;13(3):211–216. doi: 10.1016/0921-4488(94)90066-3. [DOI] [Google Scholar]
- 6.Aganga AA, Omphile UJ, Thema T, Baitshotlhi JC. Chemical composition of napier grass (Pennisetum purpureum) at different stages of growth and napier grass silages with additives. J. Biosci. 2005;5(4):493–496. doi: 10.3923/jbs.2005.493.496. [DOI] [Google Scholar]
- 7.Ganskopp D, Bohnert D. Nutritional dynamics of 7 Northern Great Basin grasses. J. Range Manage. 2001;54:640–647. doi: 10.2307/4003664. [DOI] [Google Scholar]
- 8.Capstaff NM, Miller AJ. Improving the yield and nutritional quality of forage crops. Front. Plant Sci. 2018;9:535. doi: 10.3389/fpls.2018.00535. [DOI] [PMC free article] [PubMed] [Google Scholar]
- 9.Arzani H, Basiri M, Khatibi F, Ghorbani G. Nutritive value of some Zagros Mountain rangeland species. Small Ruminants Res. 2006;65(1–2):128–135. doi: 10.1016/j.smallrumres.2005.05.033. [DOI] [Google Scholar]
- 10.Keba HT, Madakadze IC, Angassa A, Hassen A. Nutritive value of grasses in semi-arid rangelands of Ethiopia, Local experience based herbage preference evaluation versus laboratory analysis. Asian-Aust. J. Anim. Sci. 2013;26(3):366. doi: 10.5713/ajas.2012.12551. [DOI] [PMC free article] [PubMed] [Google Scholar]
- 11.Dhungana S, Tripathee HP, Puri L, Timilsina YP, Devkota KP. Nutritional analysis of locally preferred fodder trees of Middle Hills of Nepal, a case study from Hemja VDC, Kaski District, Nepal. J. Sci. Technol. 2012;13(2):39–44. doi: 10.3126/njst.v13i2.7712. [DOI] [Google Scholar]
- 12.Talore, D. G. Evaluation of major feed resources in crop-livestock mixed farming systems, southern Ethiopia, Indigenous knowledge versus laboratory analysis results. J. Agric. Rural Dev. 116(2), 157–166 (2015). http://nbn-resolving.de/urn:nbn:de:hebis:34-2015061048507.
- 13.Geng Y, Ranjitkar S, Yan Q, He Z, Su B, Gao S, Xu J. Nutrient value of wild fodder species and the implications for improving the diet of mithun (Bos frontalis) in Dulongjiang area, Yunnan Province, China. Plant Diversity. 2020;42(6):455–463. doi: 10.1016/j.pld.2020.09.007. [DOI] [PMC free article] [PubMed] [Google Scholar]
- 14.Sayed MAI, Kulkarni S, Kulkarni D, Pande A, Kauthale V. Nutritional study of local fodder species in Ahmednagar district of western Maharashtra. Agric. Sci. Digest A Res. J. 2017;37(2):154–156. doi: 10.18805/asd.v37i2.7979. [DOI] [Google Scholar]
- 15.Evitayani LW, Fariani A, Ichinohe T, Fujihara T. Study on nutritive value of tropical forages in North Sumatra, Indonesia. Asian-Aust. J. Anim. Sci. 2004;17(11):1518–1523. doi: 10.5713/ajas.2004.1518. [DOI] [Google Scholar]
- 16.Kanak AR, Khan MJ, Debi MR, Pikar MK, Aktar M. Nutritive value of three fodder species at different stages of maturity, Bangladesh. J. Anim. Sci. 2012;41(2):90–95. doi: 10.3329/bjas.v41i2.14123. [DOI] [Google Scholar]
- 17.Rahim I, Maselli D, Rueff H, Wiesmann U. Indigenous fodder trees can increase grazing accessibility for landless and mobile pastoralists in northern Pakistan. Pastoral. Res. Policy Pract. 2011;1(2):1–2. doi: 10.1186/2041-7136-1-2. [DOI] [Google Scholar]
- 18.Sultan J, Inam-ur-rahim I, Nawaz H, Yaqoob M, Javed I. Mineral composition, palatability and digestibility of free rangeland grasses of northern grasslands of Pakistan. Pak. J. Bot. 2008;40(5):2059–2070. [Google Scholar]
- 19.Bano G, Islam M, Ahmad S, Aslam S, Koukab S. Seasonal variation in nutritive value of Chrysopogon aucheri (boiss) stapf., and Cymbopogon jwarancusa (jones) schult., in highland Balochistan, Pakistan. Pak. J. Bot. 2009;41(2):511–517. [Google Scholar]
- 20.Rafay M, Khan RA, Yaqoob S, Ahmad M. Nutritional evaluation of major range grasses from Cholistan Desert. Pak. J. Nutr. 2013;12(1):23–29. doi: 10.3923/pjn.2013.23.29. [DOI] [Google Scholar]
- 21.Sultan, J. I., Manzoor, M. N., Shahzad, M. A. & Nisa M. Nutritional profile and in situ digestion kinetics of some irrigated grasses at pre-bloom stage. In International Conference on Biology, Environment and Chemistry 455–463 (2011). 10.3923/pjn.2013.23.29.
- 22.Ahmed K, Shaheen M, Mirzaei F, Khan ZI, Gondal S, Fardous A, Hussain A, Arshad F, Mehmood T. Proximate analysis, Relative feed values of various forage plants for ruminants investigated in a semi-arid region of Punjab, Pakistan. J. Agric. Sci. 2013;27(6):302. doi: 10.4236/as.2013.46043. [DOI] [Google Scholar]
- 23.Manzoor MN, Sultan JI, Nisa MU, Bilal MQ. Nutritive evaluation and in-situ digestibility of irrigated grasses. J. Anim. Plant Sci. 2013;23:1223–1227. [Google Scholar]
- 24.Sultan JI, Rahim IU, Nawaz H, Yaqoob M. Nutritive value of marginal land grasses of northern grasslands of Pakistan. Pak. J. Bot. 2007;39(4):1071–1082. [Google Scholar]
- 25.Khan RI, Alam MR, Amin MR. Effect of season and fertilizer on species composition and nutritive value of native grasses. Asian-Aust. J. Anim. Sci. 1999;12(8):1222–1227. doi: 10.5713/ajas.1999.1222. [DOI] [Google Scholar]
- 26.Grant K, Kreyling J, Dienstbach LFH, Beierkuhnlein C, Jentsch A. Water stress due to increased intra-annual precipitation variability reduced forage yield but raised forage quality of a temperate grassland. Agric. Ecosyst. Environ. 2014;186:11–22. doi: 10.1016/j.agee.2014.01.013. [DOI] [Google Scholar]
- 27.Ray DK, Gerber JS, MacDonald GK, West PC. Climate variation explains a third of global crop yield variability. Nat. Commun. 2015;6(1):1–9. doi: 10.1038/ncomms6989. [DOI] [PMC free article] [PubMed] [Google Scholar]
- 28.Egeru A, Wasonga O, Gabiri G, MacOpiyo L, Mburu J, Mwanjalolo Majaliwa JG. Land cover and soil properties influence on forage quantity in a semiarid region in East Africa. Appl. Environ. Soil Sci. 2019 doi: 10.1155/2019/6874268. [DOI] [Google Scholar]
- 29.Mertens, D. R. Interpretation of forage analysis reports. In 30th National Alfalfa symposium. Las vegas, NV. (2000).
- 30.Hussain F, Durrani MJ. Nutritional evaluation of some forage plants from Harboi Rangeland, Kalat, Pakistan. Pak. J. Bot. 2009;41(3):1137–1154. [Google Scholar]
- 31.Ammar H, López S, Bochi-Brum O, García R, Ranilla MJ. Composition and in vitro digestibility of leaves and stems of grasses and legumes harvested from permanent mountain meadows at different stages of maturity. J. Anim. Feed Sci. 1999;8(4):599–610. doi: 10.22358/jafs/69184/1999. [DOI] [Google Scholar]
- 32.Faichney GJ, Gordon GLR, Welch RJ, Rintoul AJ. Effect of dietary free lipid on anaerobic fungi and digestion in the rumen of sheep. Aust. J. Agric. Res. 2002;53(5):519–527. doi: 10.1071/AR01143. [DOI] [Google Scholar]
- 33.Khan S, Anwar K, Kalim K, Saeed A, Shah SZ. Nutritional evaluation of some top fodder tree leaves and shrubs of District Dir (Lower), Pakistan as a quality livestock feed. Int. J. Curr. Microbiol. Appl. Sci. 2014;3(5):941–947. [Google Scholar]
- 34.Tudsri S, Kaewkunya C. Effect of leucaena row spacing and cutting intensity on the growth of leucaena and three associated grasses in Thailand. Asian Aust. J. Anim. Sci. 2002;15(7):986–991. doi: 10.5713/ajas.2002.986. [DOI] [Google Scholar]
- 35.Nasrullah M, Niimi R, Akashi X, Kawamura O. Nutritive evaluation of forage plants grown in South Sulawesi, Indonesia. Asian Aust. J. Anim. Sci. 2003;16(5):693–701. doi: 10.5713/ajas.2004.63. [DOI] [Google Scholar]
- 36.Yahaya MS, Kawai M, Takahashi J, Matsuoka S. The effects of different moisture content and ensiling time on silo degradation of structural carbohydrate of orchard grass. Asian Aust. J. Anim. Sci. 2002;15(2):213–217. doi: 10.5713/ajas.2002.213. [DOI] [Google Scholar]
- 37.Norton, B. W. Differences between species in forage quality. In Nutritional Limits to Animal Production from Pastures, proceedings of an international symposium held at St. Lucia, Queensland, Australia, UK. Commonwealth Agricultural Bureaux, (1982).
- 38.National Research council . Nutrient Requirements of Dairy Cattle. 7. National Academy Press; 2001. [Google Scholar]
- 39.Nogueira Filho JCM, Fondevila M, Urdaneta AB, Ronquillo MG. In vitro microbial fermentation of tropical grasses at an advanced maturity stage. Anim. Feed Sci. Technol. 2000;83(2):145–157. doi: 10.1016/S0377-8401(99)00123-6. [DOI] [Google Scholar]
- 40.National Research Council . Nutrient Requirements of Sheep, Vol ***5. National Academies Press; 1985. [Google Scholar]
- 41.Erickson, P. S. & Kalscheur, K. F. Nutrition and feeding of dairy cattle. In Animal Agriculture pp 157–180 (2020).
- 42.Holechek JL, Pieper RD, Herbel CH. Range Management Principles and Practices. 5. Prentice-Hall; 2004. [Google Scholar]
- 43.Saro C, Mateo J, Caro I, Carballo DE, Fernández M, Valdés C, Giráldez FJ. Effect of dietary crude protein on animal performance, blood biochemistry profile, ruminal fermentation parameters and carcass and meat quality of heavy fattening Assaf lambs. Animals. 2020;10(11):2177. doi: 10.3390/ani10112177. [DOI] [PMC free article] [PubMed] [Google Scholar]
- 44.Buckmaster DR. Forage Looses, Equal Economic Looses Agricultural Engineer Fact Shell PM-107. The Pennsylvania State University; 1990. [Google Scholar]
- 45.Paulson, J., Jung, H., Raeth-Knight, M. & Linn, J. Grass vs. legume forages for dairy cattle (2008). https://conservancy.umn.edu/bitstream/handle/11299/204154/SF95_M658a-69-2008_magr56173.pdf?sequence=1.
- 46.Lüscher A, Mueller-Harvey I, Soussana JF, Rees RM, Peyraud JL. Potential of legume-based grassland–livestock systems in Europe: A review. Grass Forage Sci. 2014;69(2):206–228. doi: 10.1111/gfs.12124. [DOI] [PMC free article] [PubMed] [Google Scholar]
- 47.Van Soest PJ. Nutritional Ecology of the Ruminant. 2. Cornell University Press; 1994. [Google Scholar]
- 48.Tucak M, Ravlic M, Horvat D, Cupic T. Improvement of forage nutritive quality of alfalfa and red clover through plant breeding. Agronomy. 2021;11(11):2176. doi: 10.3390/agronomy11112176. [DOI] [Google Scholar]
- 49.Harper K, McNeill D. The role iNDF in the regulation of feed intake and the importance of its assessment in subtropical ruminant systems (the role of iNDF in the regulation of forage intake) Agriculture. 2015;5(3):778–790. doi: 10.3390/agriculture5030778. [DOI] [Google Scholar]
- 50.Singh, G. P. & Oosting, S. J. A model for describing the energy value of straws. Indian Dairyman XLI 322–327 (1992). https://agris.fao.org/agris-search/search.do?recordID=NL2012083374.
- 51.Reed, J. A. & Goe, M. R. Estimating the Nutritive Value of Cereal Crop Residues, Implications for developing feeding standards for draught animals. ILCA Bulletin (1989). https://hdl.handle.net/10568/4610.
- 52.Kumar K, Soni A. Nutrient evaluation of common vegetation of Rajasthan, Pennisetum typholdenum, Cenchrus ciliaris, Cenchrus setigerus and Lasiurus sindicus. Int. J. Plant Anim. Environ. Sci. 2014;4(1):177–183. [Google Scholar]
- 53.Kramberger B, Klemenčič S. Effect of harvest date on the chemical composition and nutritive value of Cerastium holosteoides. Grass Forage Sci. 2003;58(1):12–16. doi: 10.1046/j.1365-2494.2003.00346.x. [DOI] [Google Scholar]
- 54.Raffrenato E, Fievisohn R, Cotanch KW, Grant RJ, Chase LE, Van Amburgh ME. Effect of lignin linkages with other plant cell wall components on in vitro and in vivo neutral detergent fiber digestibility and rate of digestion of grass forages. J. Dairy Sci. 2017;100(10):8119–8131. doi: 10.3168/jds.2016-12364. [DOI] [PubMed] [Google Scholar]
- 55.McDonald P, Greenhalgh JFD, Morgan CA, Edwards RA, Sinclair LA, Wilkinson RG. Animal nutrition. Pearson UK. 2022 doi: 10.1088/1755-1315/951/1/012013. [DOI] [Google Scholar]
- 56.Brown PH, Graham RD, Nicholas DGD. The effect of manganese and nitrate supply on the level of phenolics and lignin in young wheat plant. Plant Soil. 1984;81:437–440. doi: 10.1007/BF02323058. [DOI] [Google Scholar]
- 57.Mbwile RP, Uden P. Effects of age and season on growth and nutritive value of Rhodes grass (Chloris gayana cv. Kunthi) Anim. Feed Sci. Technol. 1997;65:87–98. doi: 10.1016/S0377-8401(96)01085-1. [DOI] [Google Scholar]
- 58.Hameed M, Naz N, Ahmad MSA, Islam-ud-Din RA. Morphological adaptations of some grasses from the salt range, Pakistan. Pak. J. Bot. 2008;40(4):1571–1578. [Google Scholar]
- 59.Makkar HPS. Effects and fate of tannins in ruminant animals, adaptation to tannins, and strategies to overcome detrimental effects of feeding tannin-rich feeds. Small Rumin. Res. 2003;49(3):241–256. doi: 10.1016/S0921-4488(03)00142-1. [DOI] [Google Scholar]
- 60.Patra AK. Nutritional management in organic livestock farming for improved ruminant health and production—an overview. Livestock Res. Rural Dev. 2007;19(3):41. [Google Scholar]
- 61.Akande KE, Doma UD, Agu HO, Adamu HM. Major antinutrients found in plant protein sources: Their effect on nutrition. Pak. J. Nutr. 2010;9(8):827–832. doi: 10.3923/pjn.2010.827.832. [DOI] [Google Scholar]
- 62.Tadele Y. Important anti-nutritional substances and inherent toxicants of feeds. Food Sci. Qual. Manage. 2015;36:40–47. [Google Scholar]
- 63.D'Mello, J.F. Farm animal metabolism and nutrition. Cabi Publishing. UK. (2000). https://www.researchgate.net/profile/Adegbola-Adesogan/publication/242151831_What_are_feeds_worth_A_critical_evaluation_of_selected_nutritive_value_methods/links/5852780c08aef7d030a4e95b/What-are-feeds-worth-A-critical-evaluation-of-selected-nutritive-value-methods.pdf.
- 64.Panhwar F. Anti-nutritional Factors in Oil Seeds as Aflatoxin in Ground Nut. Digitalverlag GmbH; 2005. [Google Scholar]
- 65.Huang J, Kautz M, Trowbridge AM, Hammerbacher A, Raffa KF, Adams HD, Goodsman DW, Xu C, Meddens AJH, Kandasamy D, Gershenzon J, Seidl R, Hartmann R. Tree defence and bark beetles in a drying world: Carbon partitioning, functioning and modelling. New Phytol. 2020;225(1):26–36. doi: 10.1111/nph.16173. [DOI] [PubMed] [Google Scholar]
- 66.Min BR, Barry TN, Attwood GT, McNabb WC. The effect of condensed tannins on the nutrition and health of ruminants fed fresh temperate forages, a review. Anim. Feed Sci. Technol. 2003;106(1–4):3–19. doi: 10.1016/S0377-8401(03)00041-5. [DOI] [Google Scholar]
- 67.Muetzel S, Hoffmann EM, Becker K. Supplementation of barley straw with Sesbania pachycarpa leaves in vitro: Effects on fermentation variables and rumen microbial population structure quantified by ribosomal RNA targeted probes. Br. J. Nutr. 2003;89(4):445–453. doi: 10.1079/BJN2002813. [DOI] [PubMed] [Google Scholar]
- 68.Yao LH, Jiang YM, Shi J, Tomas-Barberan FA, Datta N, Singanusong R, Chen SS. Flavonoids in food and their health benefits. Plant Foods Hum. Nutr. 2004;59(3):113–122. doi: 10.1007/s11130-004-0049-7. [DOI] [PubMed] [Google Scholar]
- 69.Tracy BF, Foster JL, Butler TJ, Islam MA, Toledo D, Vendramini JMB. Resilience in forage and grazinglands. Crop Sci. 2018;58(1):31–42. doi: 10.2135/cropsci2017.05.0317. [DOI] [Google Scholar]
- 70.Ehsen S, Qasim M, Abideen Z, Fatima R, Gul B, Ansari R, Khan MA. Secondary metabolites as anti-nutritional factors in locally used halophytic forage/fodder. Pak. J. Bot. 2016;48(2):629–636. [Google Scholar]
- 71.Mudzwiri, M. Evaluation of traditional South African leafy plants for their safety in human consumption. Doctoral Dissertation (2007).
- 72.Francis G, Kerem Z, Makkar HP, Becker K. The biological action of saponins in animal systems, A review. Brit. J. Nutr. 2002;88(6):587–605. doi: 10.1079/BJN2002725. [DOI] [PubMed] [Google Scholar]
- 73.Duke, J. Phytochemical and ethnobotanical databases (2000).
- 74.Terrill TH, Rowan AM, Douglas GB, Barry TN. Determination of extractable and bound condensed tannin concentrations in forage plants, protein concentrate meals and cereal grains. J. Sci. Food Agric. 1992;58(3):321–329. doi: 10.1002/jsfa.2740580306. [DOI] [Google Scholar]
- 75.Barry TN, McNabb WC. The implications of condensed tannins on the nutritive value of temperate forages fed to ruminants. Br. J. Nutr. 1999;81(4):263–272. doi: 10.1017/S0007114599000501. [DOI] [PubMed] [Google Scholar]
- 76.Kallah SK, Bale JD, Abdullahi US, Mohammed IR, Lawai R. Nutrient composition of native forms of semi-arid and dry-humid savannahs of Nigeria. Anim. Feed Sci. Technol. 2000;84:137–145. doi: 10.1016/S0377-8401(99)00131-5. [DOI] [Google Scholar]
- 77.Megersa E, Mengistu A, Asebe G. Nutritional characterization of selected fodder species in Abol and Lare Districts of Gambella Region, Ethiopia. J. Nutr. Food Sci. 2017;7(2):2–6. [Google Scholar]
- 78.Van Soest PJ, Robertson JB. Analysis of Forages and Fibrous Foods. Cornell University; 1985. [Google Scholar]
- 79.Moore KJ, Jung HG. Lignin and fiber digestion. J. Range Manag. 2001;54(4):420–430. doi: 10.2307/4003113. [DOI] [Google Scholar]
- 80.Ramirez RG, Haenlein GFW, Garcia-Castillo CG, Nunez-Gonzalez MA. Protein, lignin and mineral contents and In-Situ dry matter digestibility of native Mexican grasses consumed by range goats. Small Ruminant Resour. 2004;52(3):261–269. doi: 10.1016/S0921-4488(03)00257-8. [DOI] [Google Scholar]
- 81.Ronquillo MG, Fondevila M, Urdaneta AB, Newman Y. In vitro gas production from buffel grass Cenchrus ciliaris L. fermentation in relation to the cutting interval, the level of nitrogen fertilisation and the season of growth. Anim. Feed Sci. Technol. 1998;72(1–2):19–32. doi: 10.1016/S0377-8401(97)00181-8. [DOI] [Google Scholar]
- 82.Mlay PS, Pereka A, Chikula PE, Balthazary S, Igusti J, Hvelplund T, Riis Weisbjerg M, Madsen J. Feed value of selected tropical grasses, legumes and concentrates. Vet. Arch. 2006;76(1):53–63. [Google Scholar]
- 83.Arif M, Hayat Z, Saeed M, Arain MA, Shah QA, Ali F. In vitro digestibility of selected forages in Sargodha district, Pakistan. In Vitro. 2016;6(3):62–72. [Google Scholar]
- 84.Revell DK, Baker SK, Purser BB. Estimates of the intake and digestion of nitrogen by sheep grazing a Mediterranean pasture as it matures senesces. Aust. Soc. Anim. Prod. 1994;20:217–220. [Google Scholar]
- 85.Cherney DJR, Mertens DR, Moore JE. Intake and digestibility by withers as influenced by forage morphology at three levels of forage offering. J. Anim. Sci. 1990;68(12):4387–4399. doi: 10.2527/1990.68124387x. [DOI] [PubMed] [Google Scholar]
- 86.Lichtenberg, V. L. & Hemken, R. W. Hay quality. In: Grazing Management: An Ecological Perspective. Timber Press, Portland, Oregon USA (1985). https://www.pakbs.org/pjbot/PDFs/40(1)/PJB40(1)249.pdf.
- 87.de Oliveira CV, Silva TE, Batista ED, Rennó LN, Silva FF, de Carvalho IP, Martín-Tereso J, Detmann E. Urea supplementation in rumen and post-rumen for cattle fed a low-quality tropical forage. Brit. J. Nutr. 2020;124(11):1166–1178. doi: 10.1017/S0007114520002251. [DOI] [PubMed] [Google Scholar]
- 88.Rufino LM, Batista ED, Rodrigues JP, Valadares Filho SC, Paulino MF, e Silva LF, Detmann E. Effects of the amount and frequency of nitrogen supplementation on intake, digestion, and metabolism in cattle fed low-quality tropical grass. Anim. Feed Sci. Technol. 2020;260:114367. doi: 10.1016/j.anifeedsci.2019.114367. [DOI] [Google Scholar]
- 89.Njidda AA. Determining dry matter degradability of some semi-arid browse species of north-eastern Nigeria using the in vitro technique. Nigerian J. Basic Appl. Sci. 2014;18(2):160–167. doi: 10.4314/njbas.v18i2.64306. [DOI] [Google Scholar]
- 90.Rakib-Uz-Zaman SM, Iqbal A, Mowna SA, Khanom MG, Al Amin MM, Khan K. Ethnobotanical study and phytochemical profiling of Heptapleurum hypoleucum leaf extract and evaluation of its antimicrobial activities against diarrhea-causing bacteria. J. Genet. Engl. Biotechnol. 2020 doi: 10.1186/s43141-020-00030-0. [DOI] [PMC free article] [PubMed] [Google Scholar]
- 91.Rodrigues E, de Oliveira DR. Ethnopharmacology: A laboratory science? Rodriguésia. 2020;71:25. [Google Scholar]
- 92.Kellogg EA. Poaceae. In: Kubtizki K, editor. The Families and Genera of Vascular Plants. Springer; 2014. [Google Scholar]
- 93.Horwitz W. & Latimer G. W. Official methods of analysis of AOAC International. 18th Ed. Gaithersburg, Md. AOAC International (2005). 10.1071/EA9750045.
- 94.Makkar HP, Siddhuraju P, Becker K. Plant Secondary Metabolites. Humana Press; 2007. [DOI] [PubMed] [Google Scholar]
- 95.Tilley JM, Terry RA. A two stage technique for the in vitro digestion of forage crops. Grass Forage Sci. 1963;18(2):104–111. doi: 10.1111/j.1365-2494.1963.tb00335.x. [DOI] [Google Scholar]
Associated Data
This section collects any data citations, data availability statements, or supplementary materials included in this article.
Data Availability Statement
The datasets used and/or analyzed during the current study are available from the corresponding author on a reasonable request.