
Fig. 2. Taxa able to endure CST treatment benefit from its presence in the environment.
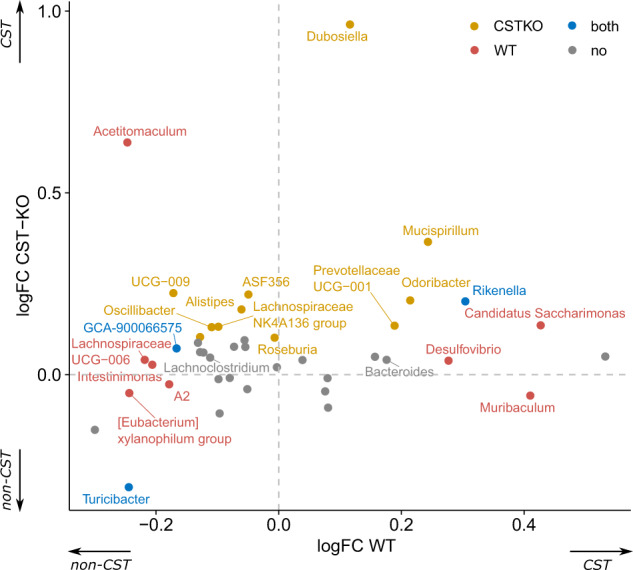
Scatter plot of log-fold changes, comparing abundance changes for significantly abundant genera between treated and untreated groups per genotype. Colors represent significance when testing for differential abundance between treated and untreated groups for each genotype.