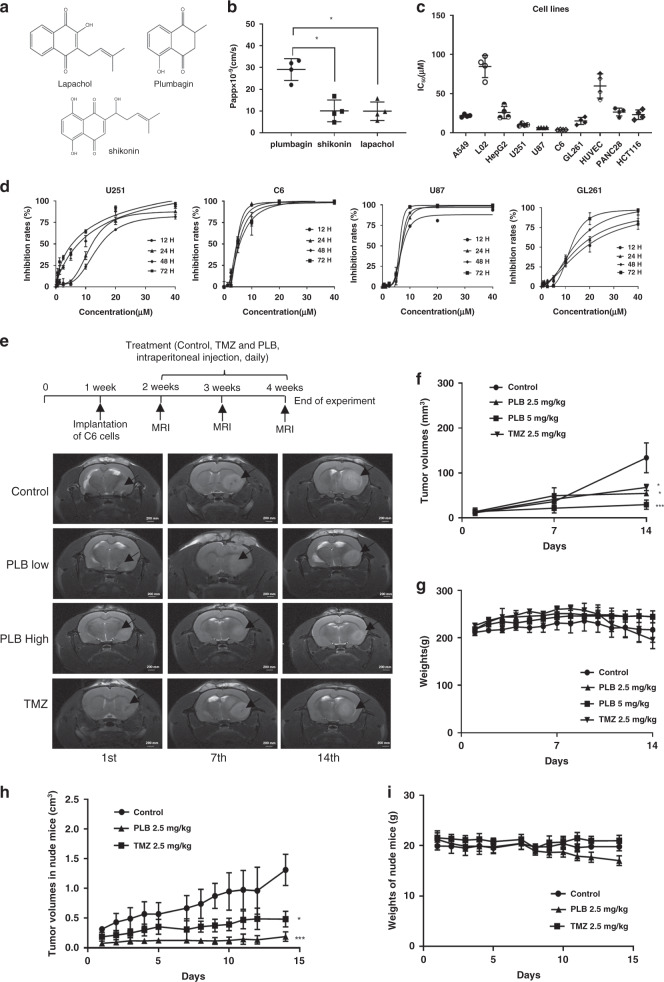
Fig. 1. PLB significantly inhibited glioma growth in vitro and in vivo.
a Chemical structures of PLB, lapachol, and shikonin; b calculated Papp × 10−9 of PLB, lapachol, and shikonin in the in vitro BBB cell model (n = 4, *P < 0.05). c IC50 of PLB in different cancer cells and normal cells via the MTS assay (n = 4). d Dose–response curves of PLB in U251, C6, U87, and GL261 glioma cells at 12, 24, 48, and 72 h (n = 3). e Schematic chart of rat orthotopic transplantation model and MRI images of C6 glioma in the brains of the rats indifferent groups on the 1st, 7th, and 14th days. f Tumour volumes of the rats in the control, TMZ, and PLB groups (n = 6, *P < 0.05, ***P < 0.005). g Body weights of the rats in the control, TMZ, and PLB groups (n = 6). h Tumour volumes of the nude mice in the control, TMZ, and PLB groups recorded during the experiment (n = 6, *P < 0.05, ***P < 0.005). i Body weights of the mice in the control, TMZ, and PLB groups recorded during the experiment (n = 6). The results were all expressed as mean ± S.D.

