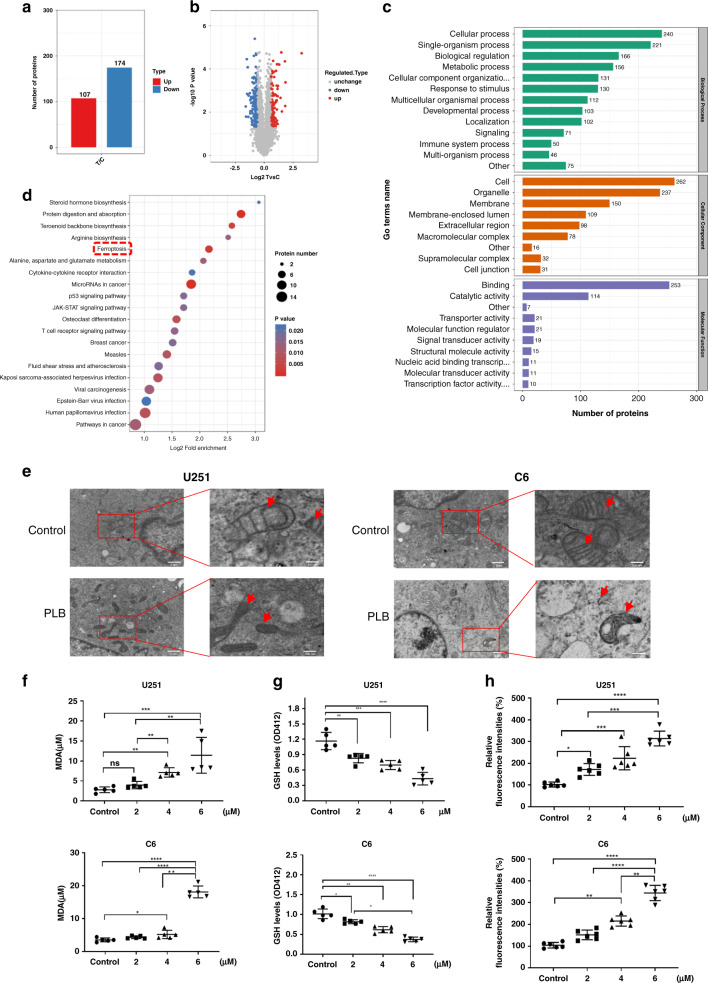
Fig. 2. PLB induced ferroptosis in glioma cells.
a Label-free quantitative proteomic analysis of the number of differentially expressed proteins in the control and PLB-treated cells (n = 3). b Volcano plot of differentially expressed proteins. The threshold of the differential expression change was set at 1.5 times, and P < 0.05 was set as the significance threshold. c Differentially expressed proteins were classified into three main categories (cellular component, biological process and molecular function) via GO annotation. d Bubble diagram of KEGG enrichment results of differentially expressed proteins. e Transmission electronic microscopy images of U251 and C6 cells with or without 4 μM PLB treatment (n = 3). f Malondialdehyde (MDA) levels in U251 and C6 cells with or without 2, 4, and 6 μM PLB treatment (n = 5). g Intracellular GSH levels in U251 and C6 cells treated with 0, 2, 4, and 6 μM PLB (n = 5). h Relative fluorescence intensities of DCFH-DA in U251 and C6 cells treated with 0, 2, 4, and 6 μM PLB (n = 6). All results are expressed as mean ± S.D. *P < 0.05, **P < 0.01, ***P < 0.005, ****P < 0.001.

