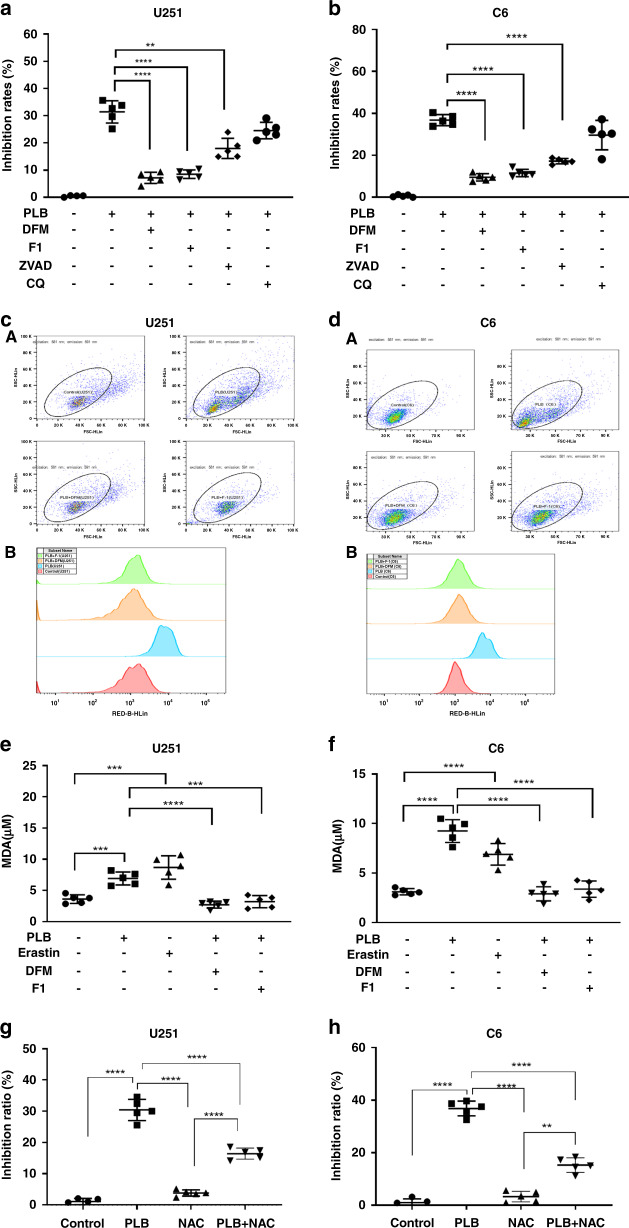
Fig. 3. PLB induced ferroptosis-dependent cell death.
a, b Inhibitory effects of PLB on U251 and C6 cells in the presence of ferroptosis inhibitors (10 μM DFM and 1.25 μM F-1), apoptosis inhibitor (2 μM ZVAD), and autophagy inhibitor (10 μM CQ) via the MTS assay (n = 5). cA, dA Fluorescence intensities of C11-BODIPY581/591 in PLB treated U251 and C6 cells in the presence of ferroptosis inhibitors (10 μM DFM and 1.25 μM F-1) detected via flow cytometry. cB, dB Quantification of the fluorescence intensities detected with flow cytometry in cA, dA, respectively (n = 3). e, f MDA levels observed through the TBARS assay in U251 and C6 cells treated with 4 μM PLB in the presence of ferroptosis inhibitors (10 μM DFM and 1.25 μM F-1) (n = 5). g, h Inhibitory effects of PLB on U251 and C6 cells in the presence of NAC (10 μM) (n = 5). Results are expressed as mean value ± S.D. **P < 0.01, ***P < 0.005, and ****P < 0.001 versus the control group.

