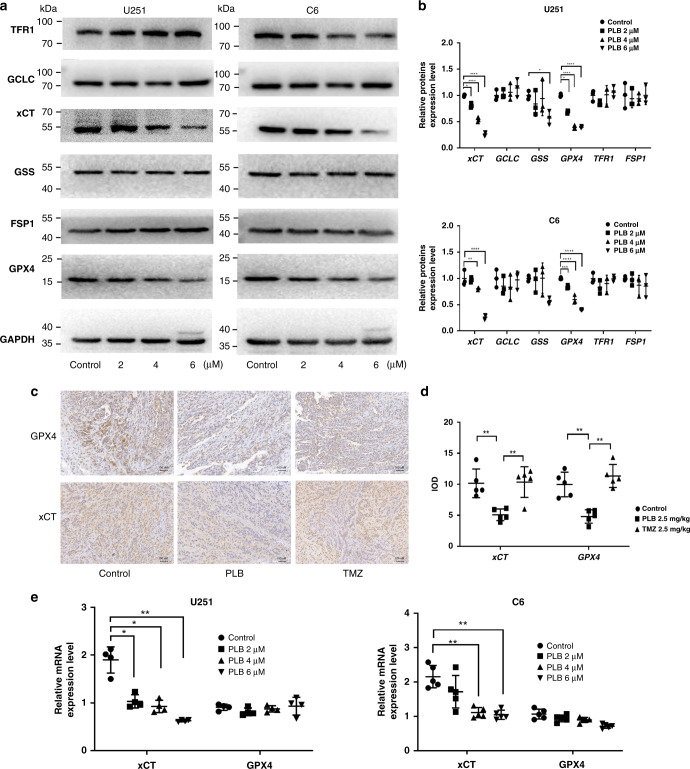
Fig. 4. xCT and GPX4 expression levels decreased in PLB-induced ferroptosis.
a Representative western blot results of ferroptosis-related protein expression levels in U251 and C6 cells treated with PLB. b Quantitation of western blot results of ferroptosis-related proteins. GAPDH served as the loading control (n = 4). c Representative immunohistochemical staining results of xCT and GPX4 in xenograft glioma tissues in nude mice treated with PLB or TMZ. Scale bar, 100 μm. d Statistical analysis of immunohistochemical staining results of xCT and GPX4 (n = 5). e mRNA expression levels of xCT and GPX4 in U251 (n = 4) and C6 cells (n = 5) treated with PLB. The results are expressed as mean value ± S.D. *P < 0.05, **P < 0.01, ***P < 0.005, and ****P < 0.001 versus the control group.

