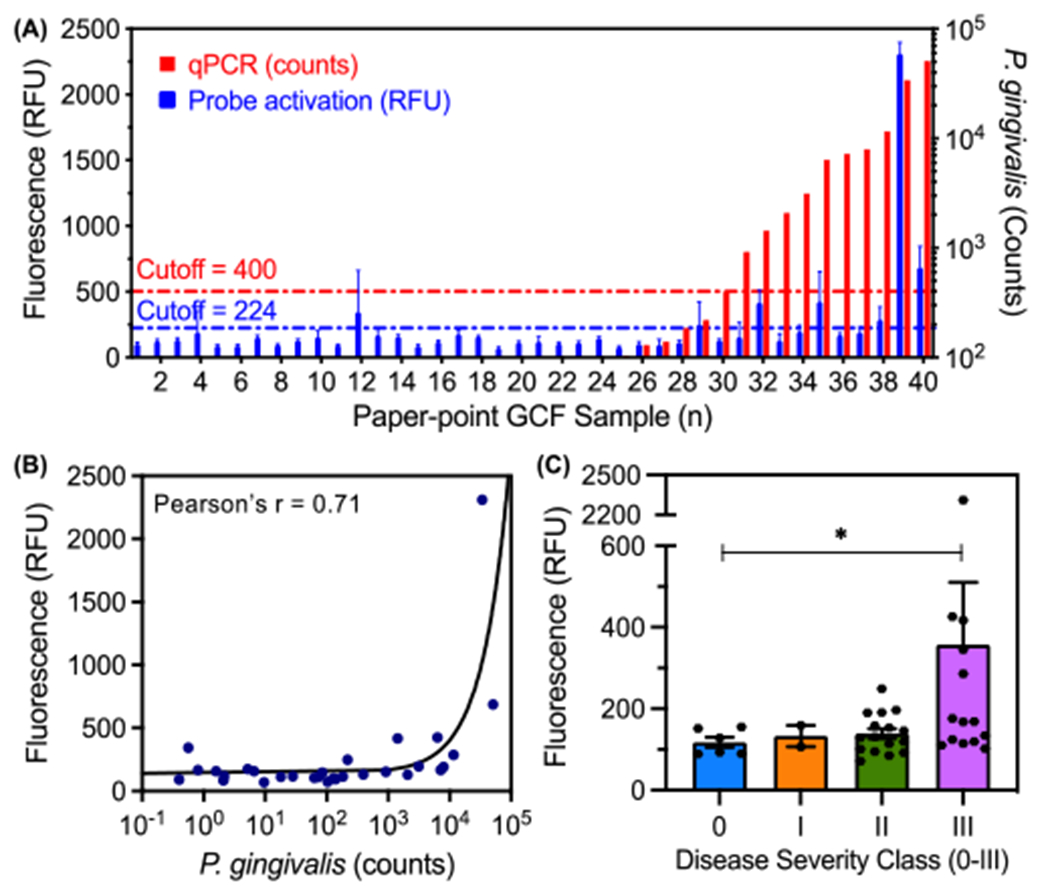
Figure. 5.

Comparison between qPCR for P. gingivalis and fluorescence of C2A probe in GCF samples from a set of 20 subjects (n = 40 tooth sites). (A) Number of P. gingivalis cells (red) and probe activation (blue, gingipain activity) for each GCF sample (error bars = SD of fluorescence area scans, n = 13 points per well). (B) Correlation between number of P. gingivalis cells and probe activation (Pearson’s r = 0.71, two-tailed, p < 0.0001). (C) Probe activation for individual tooth sites from human subjects as a function of clinically diagnosed periodontal disease severity (Welch’s one-tailed t-test, 90% confidence: p-value = 0.07 < 0.10, error bars = SEM).
