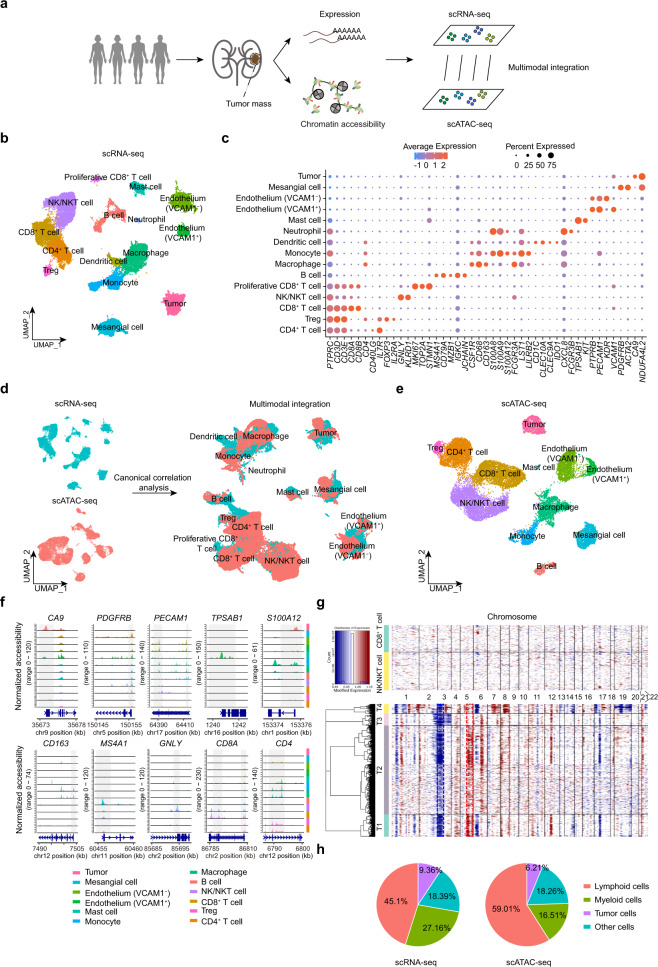
Fig. 1. Single-cell transcriptional and chromatin accessibility profiling of human ccRCC.
a Schematic of multiomics profiling of chromatin accessibility and transcription in ccRCC using scRNA-seq and scATAC-seq. b scRNA-seq UMAP projection of 38,097 single cells from four ccRCC samples. c Dot plot showing the gene expression patterns of cell-type marker genes in the scRNA-seq data. d Cross-platform linkage of scATAC-seq cells with scRNA-seq cells. e scATAC-seq UMAP projection of 21,272 single cells from three ccRCC samples. f Normalized chromatin accessibility profiles for each cell type at canonical marker genes. The promoter region is highlighted in gray with the gene model and chromosome position shown below. g Heatmap of CNV signals normalized against the “normal” cluster shown in the top panel (CD8+ T cells and NK/NKT cells) for CNV changes by chromosome (columns) within individual cells (rows). All cells in the tumor population (bottom panel) exhibited chromosome 3p loss (blue dotted frame) or chromosome 5q gain (red dotted frame), which are classic genomic features of ccRCC. h Pie charts of the proportion of each class in the scRNA-seq and scATAC-seq dataset.

