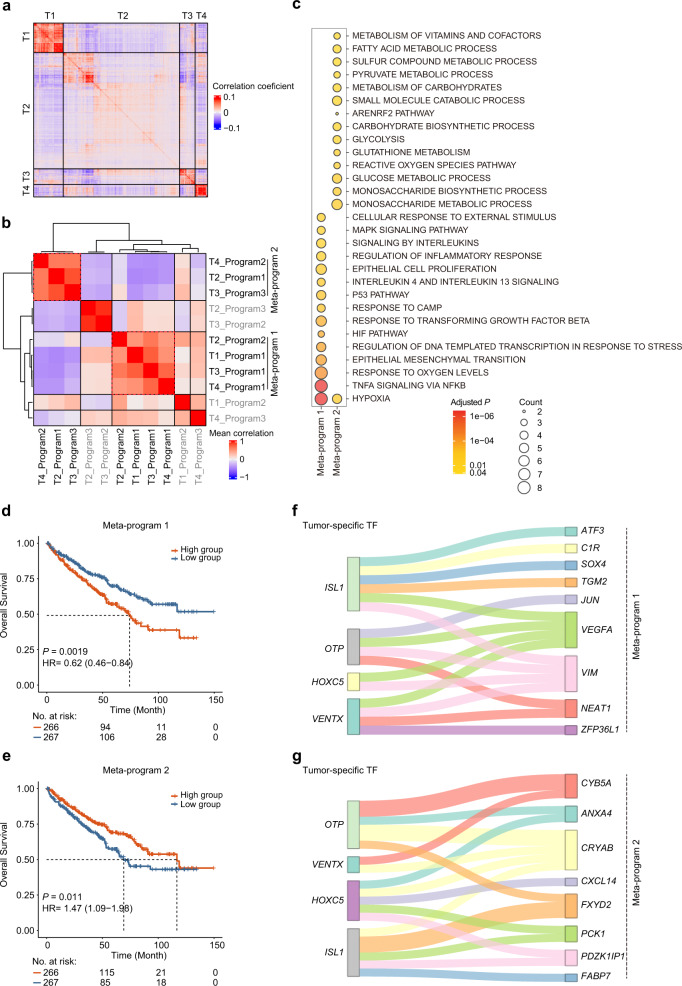
Fig. 4. Deciphering malignant transcriptional programs within ccRCC.
a Pairwise correlations between the expression profiles of four scRNA-seq samples (3564 cells). b Heatmap of average correlations across four samples between pairs of programs. c Dot plot showing significantly enriched pathways for signature genes of each meta-program. The color shade of the dot indicates the P value after FDR correction (the redder, the smaller adjusted P value), and the size of the dot represents the number of genes in the indicated pathway (the larger, the more genes included). d, e The Kaplan–Meier overall survival curves of TCGA-KIRC patients grouped by the average gene expression of meta-program 1 and meta-program 2 (with the median as the threshold). The P value was calculated by the log-rank test. HR, hazard ratio. f, g Sankey diagrams showing the regulatory relationship between the four tumor-specific TFs and genes within meta-program 1 and meta-program 2.

