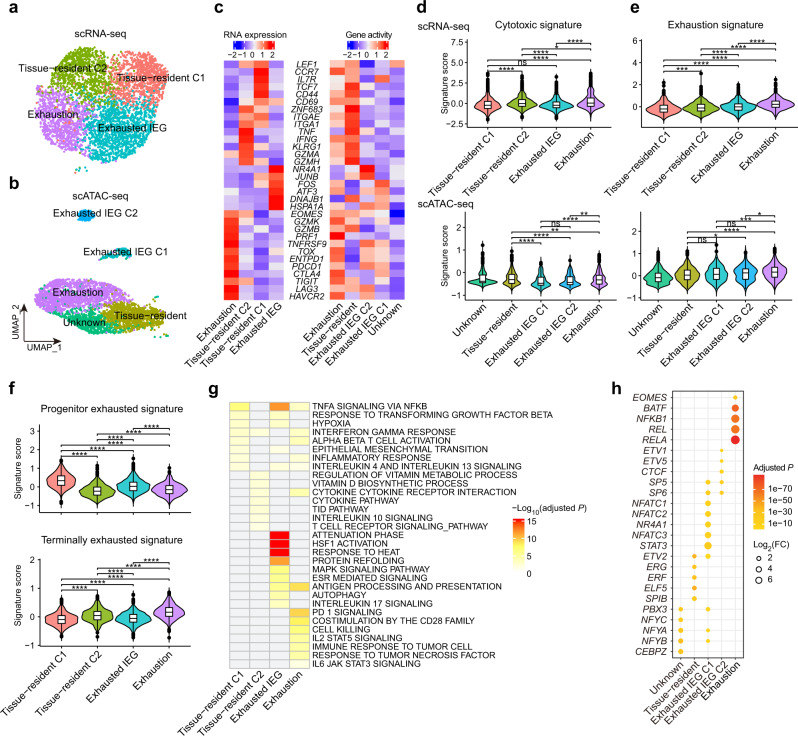
Fig. 5. Characterization of CD8+ T cells in ccRCC.
a, b Subclustering of CD8+ T cells on the UMAP plots of the scRNA-seq and scATAC-seq datasets. c Heatmap of CD8+ T cell lineage and functional markers provided phenotypic information for individual CD8+ T cell clusters in the scRNA-seq (left) and scATAC-seq (right) data. d, e Violin plots showing the signature scores of cytotoxic and exhaustion gene sets for each CD8+ T cell cluster in the scRNA-seq (top) and scATAC-seq data (bottom). Signature scores for each cell were calculated by the VISION method. Two-sided Wilcoxon test. ns, no significance; *P < 0.05; **P < 0.01; ***P < 0.001; ****P < 0.0001. f Violin plots showing the progenitor and terminally exhausted signature scores for each CD8+ T cell cluster in the scRNA-seq data. Signature scores for each cell were calculated by the VISION method. Two-sided Wilcoxon test. ns, no significance; *P < 0.05; **P < 0.01; ***P < 0.001; ****P < 0.0001. g Heatmap of significantly enriched pathways for DEGs of each CD8+ T cell cluster in the scRNA-seq data. The darker the red color is, the smaller the adjusted P value. h Dot plot showing the top enriched TFs within each CD8+ T cell subpopulation individually.

