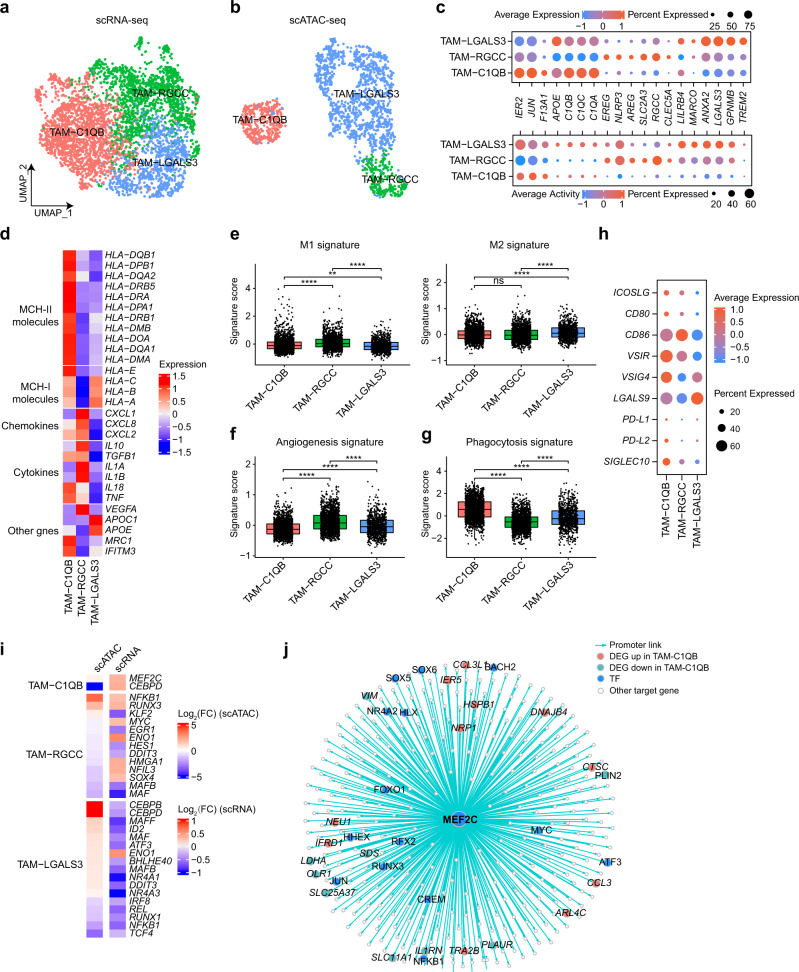
Fig. 6. Characterization of TAMs in ccRCC.
a, b Subclustering of TAMs on the UMAP plots of the scRNA-seq and scATAC-seq datasets. c Dot plot showing the expression levels and activity scores for known phenotypic markers in each TAM cluster. Dot size indicates the fraction of expressing cells, colored based on normalized expression or activity. d Heatmap showing the expression of MHC molecules, chemokines, cytokines, and other related genes in each TAM cluster. e Boxplots showing the M1 and M2 signature scores for each TAM cluster in the scRNA-seq data. The signature score was calculated by the VISION method. Two-sided Wilcoxon test. ns, no significance; *P < 0.05; **P < 0.01; ***P < 0.001; ****P < 0.0001. f, g Boxplot showing the angiogenesis and phagocytosis signature scores for each TAM cluster in the scRNA-seq data. The signature score was calculated by the VISION method. Two-sided Wilcoxon test. ns, no significance; *P < 0.05; **P < 0.01; ***P < 0.001; ****P < 0.0001. h Dot plot showing the expression of the immune costimulatory, checkpoint, and evasion genes for each TAM cluster in the scRNA-seq dataset. i Heatmap of log2(FC) values for TFs with significant differences both in the scRNA-seq and scATAC-seq datasets. j TF regulatory network showing the predicted target genes for MEF2C in the TAM-C1QB cluster.

