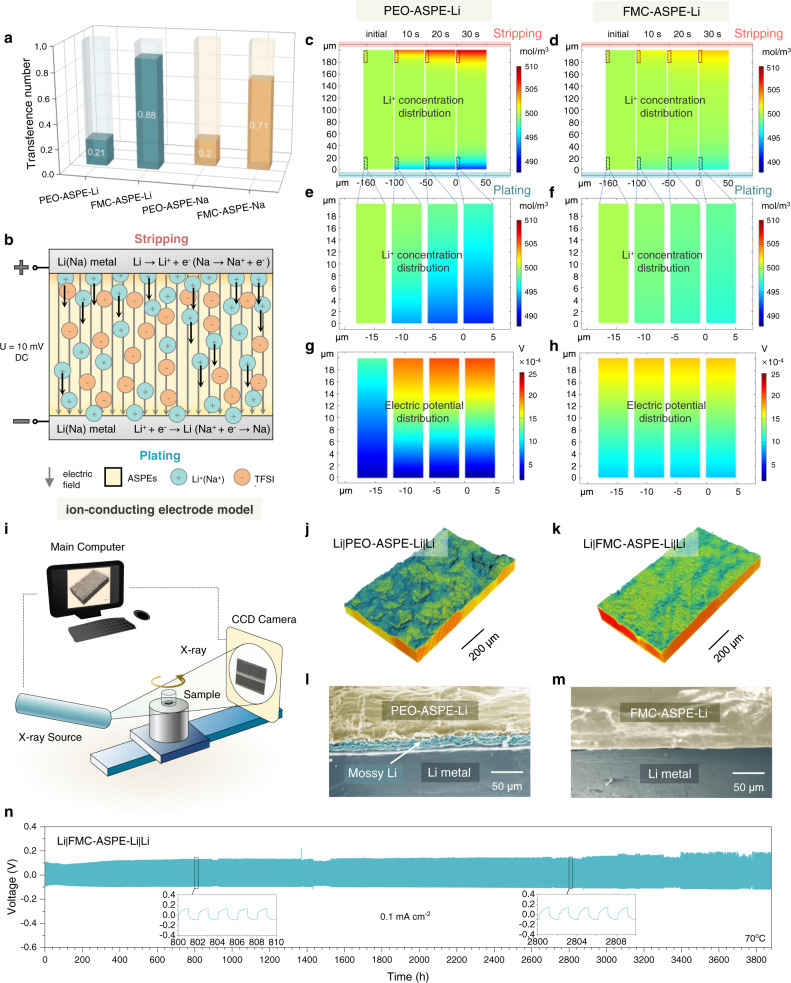
Fig. 5. Investigation of the lithium- and sodium- ion transference number via electrochemical measurements and simulations.
a Comparison of the transference number before and after the addition of 21-β-CD-g-PTFEMA. b The physical model used for the finite-element method simulations (FEMSs). c–h The Li+ concentration distribution obtained from FEMS results of the c whole region of PEO-ASPE-Li membrane, d whole region of FMC-ASPE-Li membrane, e near-region of the Li-plating side in the PEO-ASPE-Li membrane, and f near-region of the Li-plating side in the FMC-ASPE-Li membrane; the electric potential distribution obtained from FEMS results near the region of the Li-plating side in the g PEO-ASPE-Li membrane and h FMC-ASPE-Li membrane. i Schematic diagram of the working principle of X-ray tomography. j, k 3D reconstructions of the j PEO-ASPE-Li|Li and k FMC-ASPE-Li|Li interfaces after ten plating/stripping cycles, showing significantly different roughnesses. l, m Cross-sectional SEM images of l Li|PEO-ASPE-Li|Li and m Li|FMC-ASPE-Li|Li cells after cycling. n Cycling performance of the Li|FMC-ASPE-Li|Li symmetrical cell at a current density of 0.1 mA cm−2 at 70 °C.

