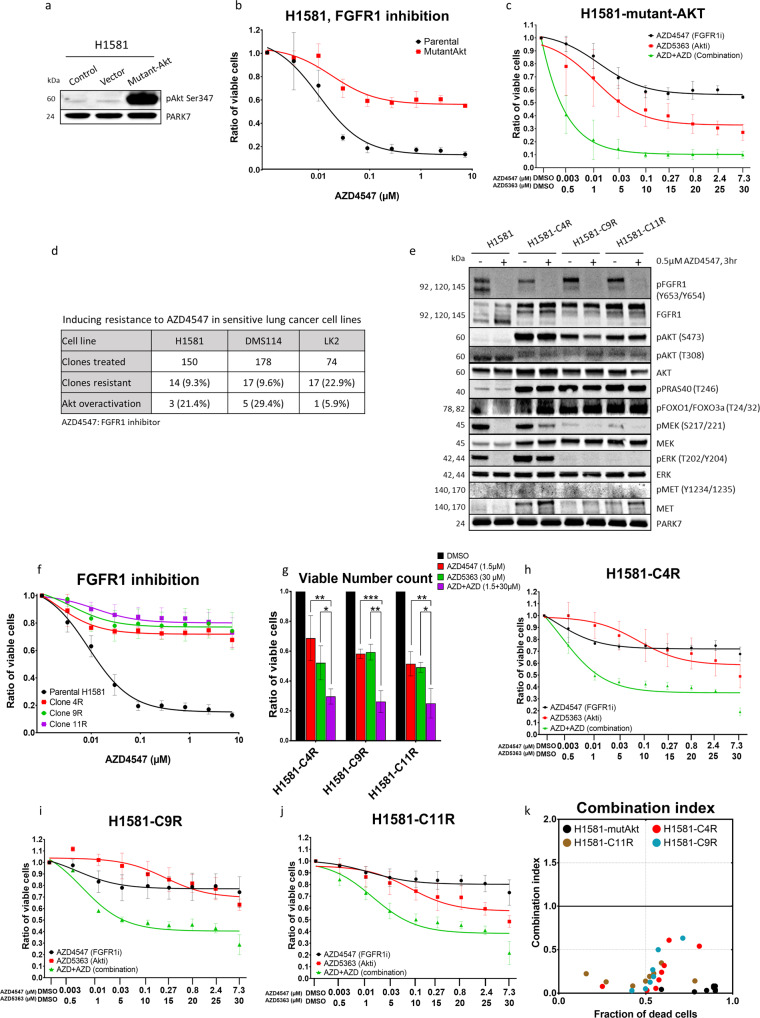
Fig. 3. Induced AKT activation promotes FGFR1 inhibition resistance in lung-cancer cells.
a Western blot analysis showing increase in AKT protein phosphorylation upon transfection with constitutively active AKT mammalian vector. b, c Cell viability assays showing the effect of single treatment of mutant and parental H1581 cell lines with AZD4547 for 96 h (b) or AZD4547 combined with AZD5363 after 96 h (c). d The table shows numbers and percentages of single cells with induced resistance after continuous treatment with AZD4547 in three lung-cancer cell lines. e Western blot analysis comparing FGFR1 and AKT expression and activation among the three induced-resistance single clones H1581-C4R, H1581-C9R and H1581-C11R with their sensitive parental control NCI-H1581 cell line. f Cell viability assay measuring the effect of AZD4547 treatment on the three named resistant clones. g Counting of viable cells using cell-cycler under treatment of AZD4547 and/or AZD5363. h–j Cell viability assay for combined AZD4547 and AZD5363 treatments after 96 h in sensitive parental control cell line H1581 and three FGFR1 inhibition-resistant clones H1581-C4R, H1581-C9R and H1581-C11R. k Combination index plot calculated with CompuSyn according to the Chou–Talalay equation algorithm: CI < 1, synergetic effect; CI = 1, additive effect; CI > 1, antagonistic effect. Statistical analysis was performed with the chi-squared test: ns (p > 0.05), *(p < 0.05), **(p ≤ 0.01) and ***(p ≤ 0.001). Mean values are plotted; error bars represent standard deviation.

