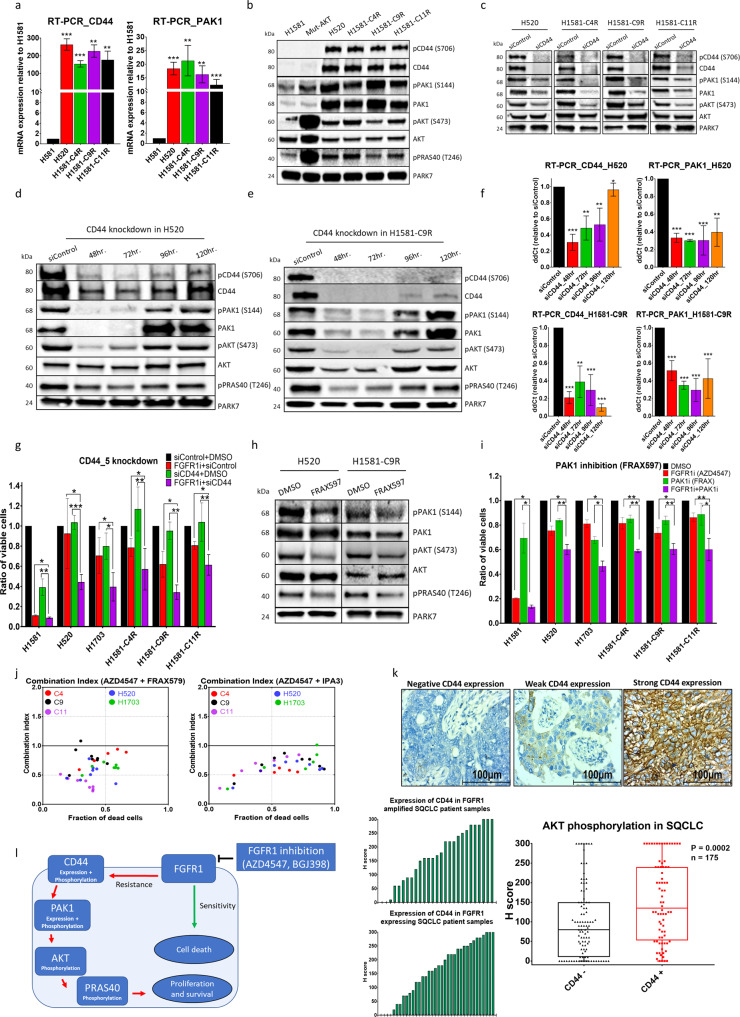
Fig. 5. CD44/PAK1 overexpression and phosphorylation promotes FGFR1 inhibition resistance through AKT activation.
a Real-time PCR to determine mRNA levels of CD44 and PAK1 in resistant cells. b Western blot analysis comparing levels of CD44, PAK1 and AKT among sensitive and resistant cells. c Western blot analysis shows the effect of CD44 knockdown among sensitive and resistant cells. d, e Effect of CD44 knockdown on PAK and AKT expression and activation in (d) H520 and (e) H1581-C9R cell lines. f Real-time PCR to determine mRNA levels of CD44 and PAK1 upon CD44 knockdown. g MTS assays show synergetic effect of combining CD44 knockdown (SI00299705) to FGFR1 inhibition in resistant cell lines. h Western blot analysis shows the effect of 3 h incubation of resistant cell lines with 1.2 µM o PAK1 inhibitor (FRAX597). i MTS assays show the synergetic effect of combining PAK1 inhibition (1.2 µM FRAX597) with FGFR1 inhibition in resistant cells. j Combination index plot showing the synergetic effect of combining two PAK1 inhibitors (IPA3 and FRAX597) with FGFR1 inhibitor (AZD4547). k Immunohistochemical staining of SQCLC patient samples with anti-CD44 antibody: correlation between CD44 expression and AKT phosphorylation within 175 lung cancer patients. l Proposed resistance axis to FGFR1 inhibition in lung cancer cells. CI plots were calculated according to the Chou–Talalay equation: CI < 1, synergetic effect; CI = 1, additive effect; CI > 1, antagonistic effect. Statistical analysis was performed with the chi-squared test: ns (p > 0.05), *(p < 0.05), **(p ≤ 0.01) and ***(p ≤ 0.001). Mean values are plotted; error bars represent standard deviation.

