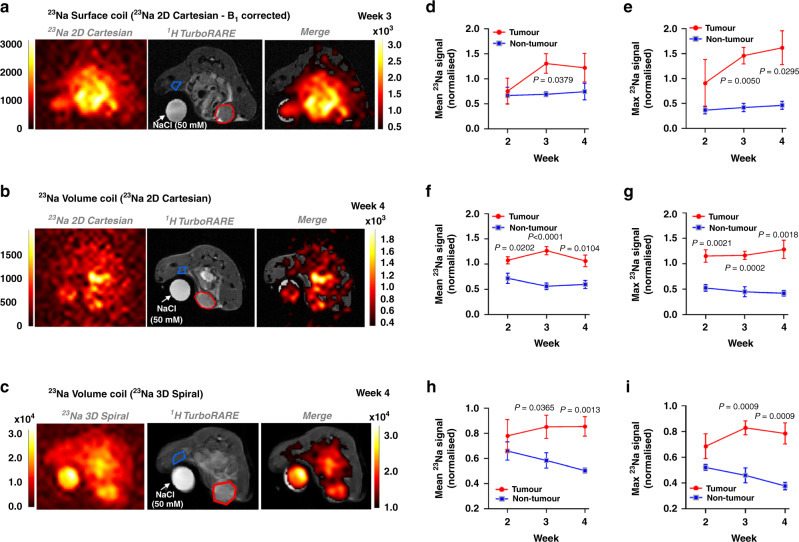
Fig. 1. 23Na MRI reveals elevated [Na+] in orthotopic xenograft tumours.
23Na imaging was performed in Rag2−/− Il2rg−/− mice bearing orthotopic MDA-MB-231 xenograft tumours at 2, 3 and 4 weeks post implantation. Representative images are shown for MRI performed using a bespoke 3 cm 23Na surface coil (a, 23Na 2D gradient-echo cartesian acquisition (2D cartesian)) or a commercial dual-tuned 1H/23Na volume coil (b, 23Na 2D cartesian; c 23Na 3D gradient-echo spiral out acquisition (3D spiral)). Regions of interest (ROIs) are annotated (tumour, red region; non-tumour, blue region). Mean and maximum 23Na signals were normalised to a NaCl phantom (50 mM) to provide a concentration measurement. Mean and maximum 23Na signals for tumour vs non-tumour regions are shown for the 23Na surface coil (d, e, 23Na 2D cartesian, n = 3 mice at all timepoints) and dual-tuned 1H/23Na volume coil (f, g 23Na 2D cartesian. Week 2, n = 5; week 3, n = 6; week 4, n = 5. h, i 23Na 3D spiral. Week 2, n = 3; week 3, n = 6; week 4, n = 6). Data represent group mean ± SEM. P-values for significant differences between tumour and non-tumour at each individual timepoint calculated using an unpaired, two-tailed Student’s t test. A mixed-effects model indicated that the effect of time was not statistically significant.

