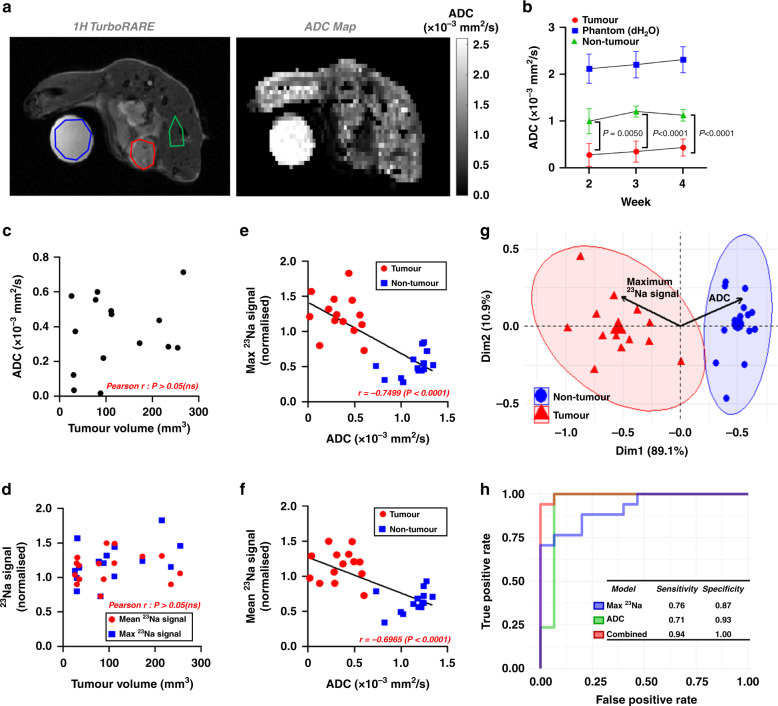
Fig. 2. 23Na MRI combined with and DWI improves tumour vs non-tumour classification accuracy.
a Corresponding 1H TurboRARE images and reconstructed ADC maps (diffusion tensor imaging, b values of 100, 300 and 700 s/mm2) were obtained from mice bearing MDA-MB-231 xenograft tumours at 2, 3 and 4 weeks post implantation. Tumour (red), phantom (blue, 50 mM NaCl) and non-tumour (green) regions of interest (ROIs) are shown. b ADC in tumour, phantom and non-tumour regions at each imaging timepoint (week 2, n = 4; week 3, n = 5; week 4, n = 6. mean ± SEM). c Tumour volume does not correlate with tumour ADC (pooled ROIs across all timepoints, n = 15). d Neither mean nor maximum 23Na signal (23Na 2D cartesian acquisition) from tumour ROIs correlate with tumour volume (n = 16). Both maximum (e) and mean (f) 23Na signal negatively correlate with ADC across all regions (tumour, red; non-tumour, blue, all timepoints pooled, n = 30). g Principal component analysis biplot of maximum 23Na signal and ADC (data from e) with loading vectors for maximum 23Na signal and ADC with 95% concentration ellipses. Receiver-operating characteristics are shown (h) for linear discriminant models trained on maximum 23Na values alone, ADC alone, or combination (training data from e, test data from DTX control cohort (Fig. 5, n = 32 regions from all timepoints). Classification sensitivity and specificity are presented in the inset. P-values for significant differences between groups calculated using an unpaired, two-tailed Student’s t test and for correlation using a Pearson r test.

