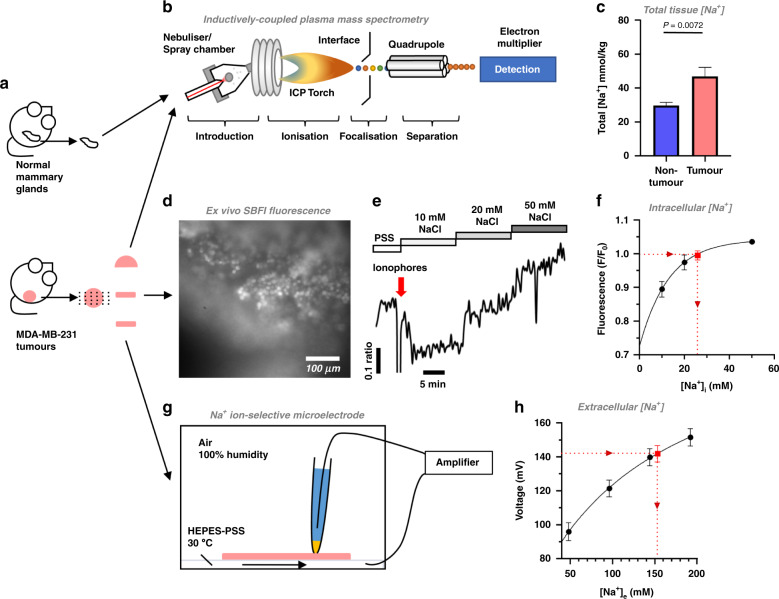
Fig. 3. [Na+]i is elevated in live xenograft tumour slices.
a Following week-4 imaging, tumours were acutely isolated, divided and prepared for inductively coupled plasma mass spectrometry (ICP-MS, b) analysis or ex vivo measurements of [Na+]i and [Na+]e. Healthy mammary glands (HMGs) from naive female mice were included in ICP-MS analysis. c Total tissue [Na+] in MDA-MB-231 xenograft tumours (n = 10) and HMGs (n = 11). d MDA-MB-231 xenograft tumour slices (200 µm) were loaded with SBFI-AM (10 µM) and immobilised for imaging. Baseline SBFI fluorescence was recorded during perfusion with HEPES-buffered physiological saline solution (PSS) containing 144 mM NaCl. e To calibrate [Na+]i for each cell in situ, perfusion was switched to 10 mM NaCl, followed by application of the ionophores (red arrow) gramicidin (3 µM), monensin (10 µM) and ouabain (1 mM). Tumour slices were sequentially perfused with 20 mM and 50 mM NaCl. The final three frames acquired during each phase were used to determine the average fluorescence for each calibration step. f [Na+]i during the baseline PSS phase (red point) was calibrated (n = 3 slices from two separate animals, 11–16 cells per experiment, F/F0) using non-linear regression (one-phase association). g Concurrently, Na+ ion-selective microelectrodes (ISMEs) calibrated with PSS of variable [Na+] (48 mM, 96 mM, 144 mM, 192 mM, no replacement ion) were used to measure [Na+]e (red point) in MDA-MB-231 xenograft tumour slices (500 µm, n = 6 slices from six separate animals, 12 recordings per slice; h). Recordings were interpolated using non-linear regression (Padé (1,1) approximant). Data represent group mean ± SEM.

