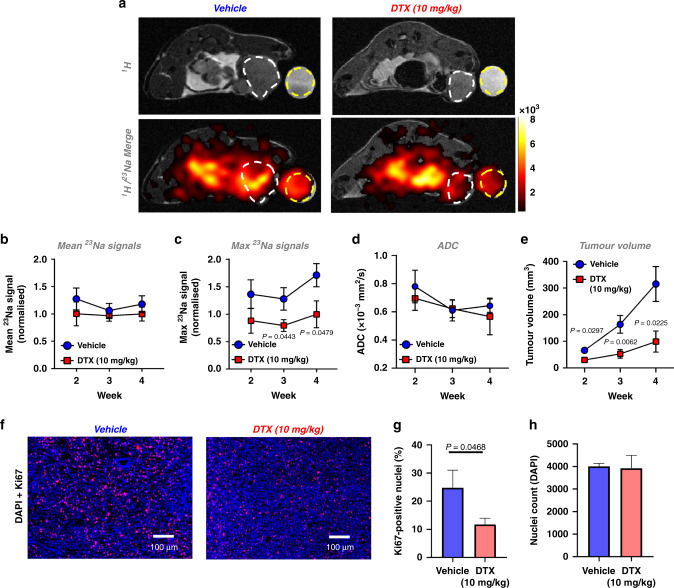
Fig. 4. Docetaxel decreases the maximum 23Na signal detected within MDA-MB-231 xenograft tumours.
Following orthotopic MDA-MB-231 cell implantation, Rag2−/− Il2rg−/− mice were randomised to receive either docetaxel (10 mg/kg) or vehicle i.p. once weekly. a Representative 1H TurboRARE and 1H/23Na 2D cartesian (merge) images for docetaxel and vehicle-treated mice at week 4 post implant; regions of interest (ROIs) for tumour (white dash) and NaCl phantom (50 mM, yellow dash) are annotated. Mean (b) and maximum (c) 23Na signals measured from tumour ROI at weeks 2, 3 and 4 post xenograft implantation (normalised to phantom to provide a concentration measurement. Vehicle, week 2, n = 7; week 3, n = 6; week 4, n = 7. Docetaxel, week 2, n = 9; week 3, n = 8; week 4, n = 7). d Effect of docetaxel on tumour ADC (Vehicle, week 2, n = 5; week 3, n = 6; week 4, n = 7. Docetaxel, week 2, n = 6; week 3, n = 8; week 4, n = 7). e Effect of docetaxel treatment on tumour growth rate (vehicle, n = 6 for all timepoints. Docetaxel, week 2, n = 8; week 3, n = 8; week 4, n = 5. Volume measured by multislice (1 mm) 1H TurboRARE imaging. f Representative images of Ki67/DAPI stained tissue tumour sections. g Ki67-positive nuclei (vehicle, n = 5; docetaxel, n = 7; 2–10 regions each section). h Nuclei counts (vehicle, n = 5; docetaxel, n = 6; 1–10 regions each section). Data represent group mean ± SEM. P-values for significant differences between groups calculated using an unpaired, two-tailed Student’s t test (b–e) or an unpaired, two-tailed nested t test (g, h).

