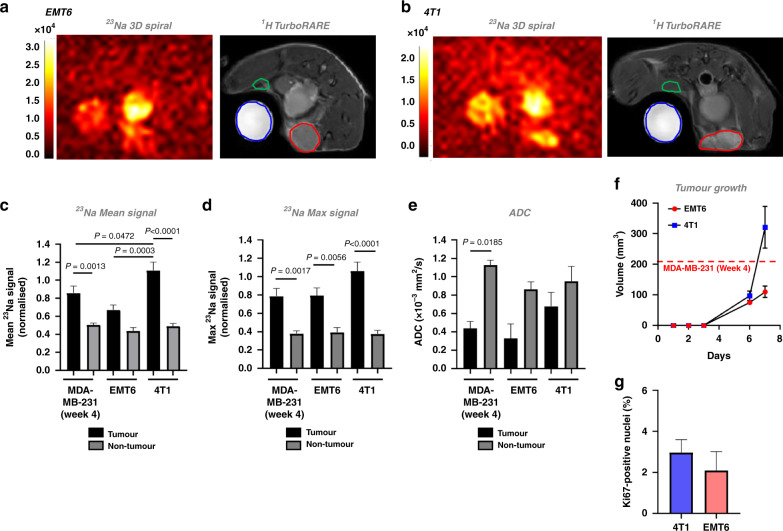
Fig. 6. Elevated tumour [Na+] is a common feature of preclinical models of breast cancer.
Representative 23Na 3D gradient-echo spiral out and 1H TurboRARE images are shown for orthotopic (a) EMT6 or (b) 4T1 allograft tumours, imaged at day 7 post implantation (tumour region of interest (ROI), red; non-tumour ROI, blue). Mean 23Na signal (c), and maximum 23Na signal (d) within tumour and non-tumour ROIs were normalised to NaCl phantom (50 mM) to provide a concentration measurement; data from MDA-MB-231 tumours at week 4 post implantation included for statistical comparison. ADC (e) was assessed by DWI. f Tumour volume (4T1 and EMT6) was calculated using the modified ellipsoidal formula volume = 1/2(length × width2); dotted line denotes the average size of MDA-MB-231 tumours at 4 weeks post implantation (see Supplemental Fig. 1a). g Ki67-positive nuclei (%) for 4T1 and EMT6 tumour sections (both groups n = 4, 3–12 regions each section). Data represent group mean ± SEM (4T1, EMT6, n = 5; MDA-MB-231, n = 6). P-values for significant differences between groups calculated using a one-way ANOVA with post hoc Tukey test for multiple comparisons (c, d), a Kruskal–Wallis test with post hoc Dunn’s test for multiple comparisons (e) or a nested t test (g).

